| The easiest way to learn how to use the IDE is to create a project in a step-by-step fashion. The first example that we will work will be a simple Hello, World program that uses println() method calls to create its output. Creating a Class in the Project The next step in running a program is the creation of a source code file. To do this, choose New Class from the File menu. This will open the dialog that is pictured in Figure A.3. Figure A.3. The Class Wizard enables you to specify details about the class that you are creating. 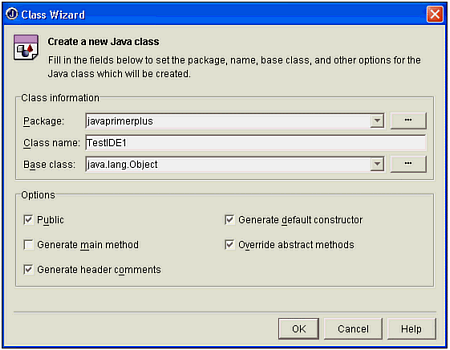 Call the name of the class TestIDE1 and specify the javaprimerplus package. Following that, add the lines shown in Listing A.1 to the class. Listing A.1 The TestIDE1.java File package javaprimerplus; public class TestIDE1 { /** Creates a new instance of TestIDE1 */ public TestIDE1() { } public static void main(String[] args) { int ans1 = 3; int ans2 = 4; int ans; String s1 = "This is "; String s2 = "String data"; String s3 = s1 + s2; ans = ans1 + ans2; System.out.println("The string is " + s3); System.out.println("The answer is " + ans); } } Before we can run this program, we need to specify the class that contains the main() method. To do this, choose Project Properties from the Project menu. This will open the dialog box shown in Figure A.4. Figure A.4. You specify the class that contains the main() method in the Project Properties dialog. 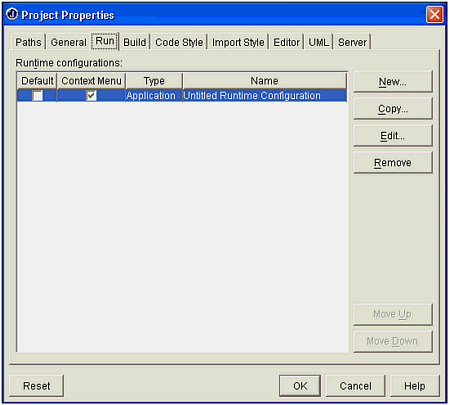 Click the New button. When the Runtime Properties dialog appears, click the Browse button and select the javaprimerplus.TestIDE1 class, as shown in Figure A.5. Figure A.5. Make your selection from the Runtime Properties dialog. 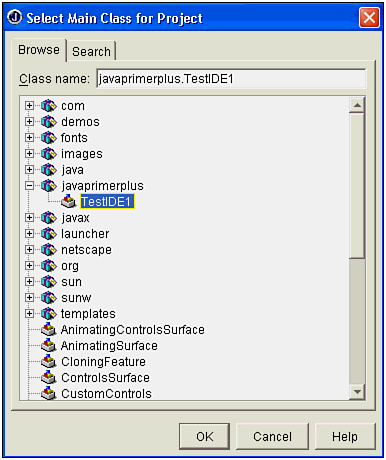 Next, click Run Project in the Run menu to execute this program. The result of running it is shown in Figure A.6. Figure A.6. Running the program in the IDE causes the output to be displayed in the Message Pane. 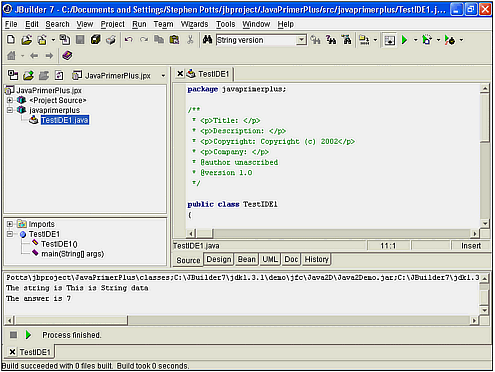 The output that appears in the Message Pane is shown here in a reformatted version. The first block of output is the Java command, followed by classpath information, and, finally, the name of the class to be run. C:\JBuilder7\jdk1.3.1\bin\javaw -classpath "C:\Documents and Settings\ Stephen Potts\jbproject\JavaPrimerPlus\classes; C:\JBuilder7\jdk1.3.1\demo\jfc\Java2D\Java2Demo.jar; C:\JBuilder7\jdk1.3.1\jre\lib\i18n.jar; C:\JBuilder7\jdk1.3.1\jre\lib\jaws.jar; C:\JBuilder7\jdk1.3.1\jre\lib\rt.jar; C:\JBuilder7\jdk1.3.1\jre\lib\sunrsasign.jar; C:\JBuilder7\jdk1.3.1\lib\dt.jar; C:\JBuilder7\jdk1.3.1\lib\htmlconverter.jar; C:\JBuilder7\jdk1.3.1\lib\tools.jar" javaprimerplus.TestIDE1 The output of the program consists of a string followed by another string that displays an integer. The string is This is String data. The answer is 7. This program will give us some processing that we can use to explore how to debug programs using JBuilder. Debugging a Java Application The IDE provides a wonderful set of tools for debugging the source code. The debugger doesn't run automatically. Before you can run the debugger, you need to tell the project what main() class you want to use when running in debug mode. The process to do this is similar to the process used to specify the main() class to be used in run mode. The first step is to choose Project Properties from the Project menu. Next, select the same runtime configuration that you used to specify the runtime main() method and click the Edit button. The Runtime properties dialog appears. Click the Run tab, and then on the Test sub tab. Using the ... button, select the same class as before, javaprimerplus.TestIDE1, as the class containing the main(), as shown in Figure A.7. Figure A.7. You can specify a different main() class in Test mode than the one that you specify in Run mode. 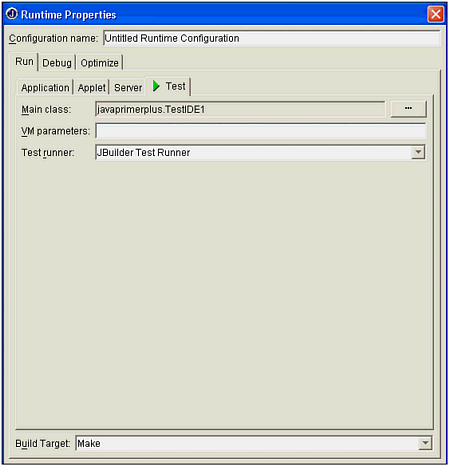 Next, you need to learn how to set a breakpoint. The easiest way to set a breakpoint is to click in the left margin of the Content pane when a Java source code file is open within it. The gray left margin is about a quarter of an inch wide. When you click it, a red circle appears indicating that a breakpoint is now set on that line. During program execution, the program will pause and wait for instructions from you when it encounters that line. As an exercise, set a breakpoint in the main method on the line that reads: System.out.println("The string is " + s3); Next, choose Debug Project from the Run menu, or click the Debug Project button in the tool bar. The program will continue until it hits the first breakpoint. It will then pause until you give it the command to continue, as shown in Figure A.8. Figure A.8. The IDE is transformed into a debugger when you run in debug mode. 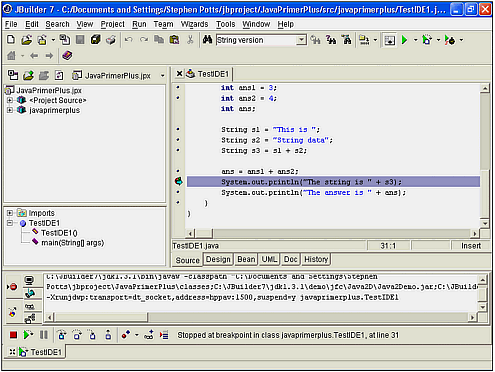 The IDE takes on a much more complicated look when in debug mode. Notice the colored line that is now resting on the line with the breakpoint, line 31. The colored line and the arrow in the margin over the red dot mean that the debugger has paused at this line waiting for you to examine variables, set new breakpoints, and so forth, before resuming. The debugging portion of the screen is located at the bottom. The red stop sign icon indicates that this is a list of all the breakpoints in the project. Clicking it changes the contents of the Message Pane, as shown in Figure A.9. Figure A.9. The debugging controls are located at the bottom of the screen. 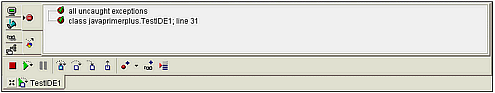 Notice that there are two breakpoints in the list. The one that we set is for line 31, and the other is for all uncaught exceptions. The meaning of all the other icons is shown here: These controls give you a great deal of power when searching for bugs in your projects. | 