| Regardless of which profiling task you choose, the IDE will display the Profiler Control Panel (shown in Figure 15-3). Figure 15-3. Profiler Control Panel 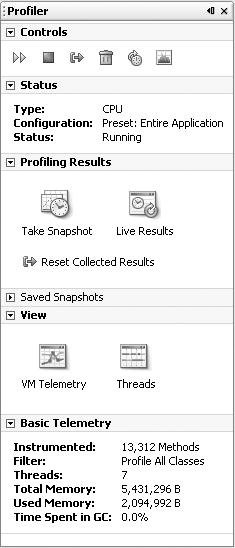
Each section of the Profiler Control Panel can be expanded or hidden by clicking the arrow icon next to the name of the section. Controls See Table 15-1 for an explanation of the buttons in the Profiler Control Panel Controls section. Table 15-1. Profiler Control Panel ControlsComponent | Description |
|---|

| ReRun Last Profiling (Ctrl-Shift-F2) Run the last profiling command again. | 
| Stop Stops the current profiling command. Also stops the target application if the application was started by the profiler. | 
| Reset Collected Results Discards the already accumulated profiling results. | 
| Run GC Runs garbage collection. | 
| Modify Profiling (Alt-Shift-F2) Opens the Modify Profiling Task dialog box and allows you to run a new profiling command without stopping the target application. | 
| VM Telemetry Opens the VM Telemetry Overview in the Output window of the IDE, displaying smaller versions of the telemetry graphs. |
Status See Table 15-2 for an explanation of the entries in the Profiler Control Panel Status section. Table 15-2. Profiler Control Panel StatusComponent | Description |
|---|
Type | The type of profiling: Monitor, CPU, or Memory | Configuration | Indicates whether the profiler was started with one of its preset configurations | Status | Running or Inactive |
Profiling Results See Table 15-3 for an explanation of the entries in the Profiler Control Panel Profiling Results section. Table 15-3. Profiler Control Panel Profiling ResultsComponent | Description |
|---|

| Take Snapshot Displays a static snapshot of the profiling results accumulated thus far | 
| Live Results Displays the current results of the profiling task |
| Reset Collected Results Discards the already accumulated profiling results |
Saved Snapshots Enables you to manage the profiling snapshots associated with your project. When you select an open project in the combo box, the saved snapshots associated with that project are displayed. Double-clicking the name of the snapshot opens the snapshot in the Source Editor window. View See Table 15-4 for an explanation of the entries in the Profiler Control Panel View section. Table 15-4. Profiler Control Panel ViewComponent | Description |
|---|
| VM Telemetry Opens the VM Telemetry tab. The VM Telemetry tab displays high-level data on thread activity and memory heap and garbage collection in the JVM. | 
| Threads Opens the Threads tab. When Enable Threads Monitoring is selected in the Select Profiling Task dialog box, application thread activity is displayed in the Threads tab. |
Basic Telemetry See Table 15-5 for an explanation of the entries in the Profiler Control Panel Basic Telemetry section. You can see the graphic presentation of some of this information by clicking the VM Telemetry and Threads buttons in the View section. Table 15-5. Profiler Control Panel Basic TelemetryComponent | Description |
|---|
Instrumented | When doing memory profiling, the number of classes with profiler instrumentation; when doing CPU performance profiling, the number of methods with profiler instrumentation. | Filter | Type of filter (if any) that was specified. | Threads | Number of active threads. | Total Memory | Allocated size of the heap. | Used Memory | Portion of the heap that is in use. | Time Spent in GC | Percentage of time spent performing garbage collection. |
|