| A profiling session typically contains the following steps: 1. | Select a project.
| 2. | Select a profiling task.
| 3. | Specify options for the selected task.
| 4. | Start the profiler and examine the data it displays.
|
If your project uses a JDK that is not supported, then the profiler will display the registered JDKs that are supported. To register a JDK with the IDE, choose Tools | Java Platform Manager; for more information, refer to the Changing the Version of the JDK Your Project Is Based On section in Chapter 3. Profiling Primer The NetBeans Profiler makes it easy for all programmers to profile their applications, even if you have never used a profiling tool before. To help you get started, here are some terms that are used throughout this chapter. Profiler. A tool that shows you the behavior of your application as it runs in the Java Virtual Machine (JVM). Instrumentation. The insertion of profiling methods (counters, timers, etc.) into the Java bytecode of your application. These methods do not change the logic of your program and are removed when profiling is stopped. Overhead. The time spent executing profiling methods, instead of your application code. Heap. The memory pool used by the JVM for all objects allocated in your program by the new operator. Garbage Collection. The removal of objects from memory that your application is no longer using. Garbage Collection is performed periodically by the JVM. Memory Leak. An object that is no longer in use by your application but that cannot be garbage collected by the JVM because of one or more inadvertent references to it. Self Time. The amount of time needed to execute the instructions in a method. This does not include the time spent in any other methods that were called by the method. Hot Spot. A method that has a relatively large Self Time. Root Method. A method selected for performance profiling. Call Tree. All methods reachable from a root method.
|
In order to profile a project, the IDE must add targets to the project's Ant build script. The first time you attempt to profile a project, the IDE will prompt for permission to modify the Ant build script in order to add those targets, as shown in Figure 15-1. Figure 15-1. Add Ant target dialog box 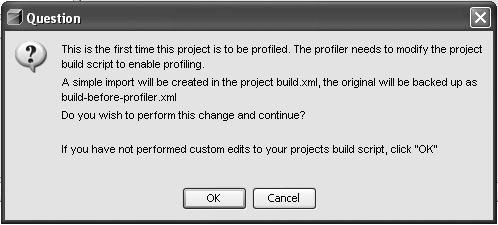
The simplest way to start using the profiler is to choose Profile | Profile Main Projectthis command will work with projects from the following New Project wizard categories:  | If you have set up a free-form project (one set up using a "with Existing Ant Script" project template), you need to do some extra configuration to get the profiling commands to work. You can either use Attach Profiler or you can add the necessary Ant target, as described in Chapter 16. |
The Profiler will display the Select Profiling Task dialog box (shown in Figure 15-2). When you click on a task button it will expand and display task-specific options. After setting the task-specific options, click Run to start the profiling session. If the profiler has never been run before on your system, then it will have to collect calibration data. Figure 15-2. Profiler Task Selection dialog box 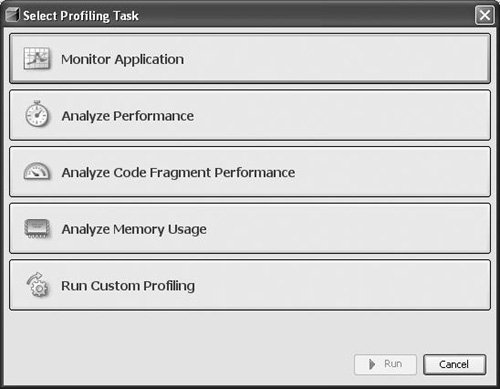
| If the profiler's calibration data gets deleted or corrupted, you can recreate it by choosing Profile | Advanced Commands | Run Profiler Calibration. |
When you are finished profiling, choose Profile | Stop. |