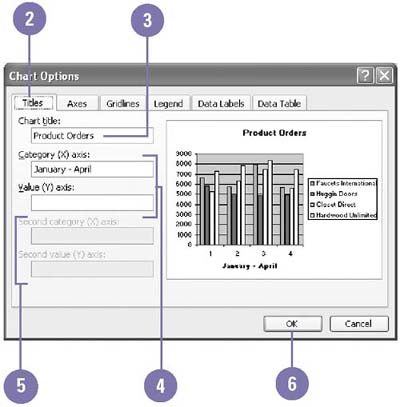
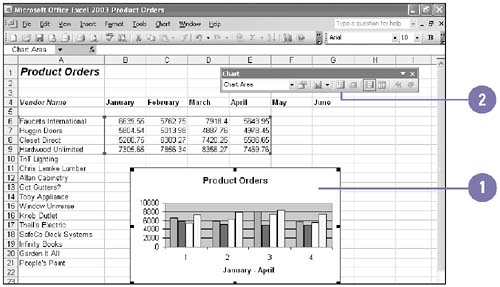
Enhancing a Chart

Add chart options to enhance the appearance of the chart and increase its overall effectiveness. Chart options include chart objects such as titles, legends, text annotations, and gridlines. A chart title identifies the primary purpose of the chart; adding a title for each axis also clarifies the data that you're plotting. Titles can be any length, and you can format them just like other worksheet text. A legend associates the colors and patterns in a chart with the data they represent. Legend text is derived from the data series plotted within a chart. You can rename an item within a legend by changing the text in the data series. Gridlines are horizontal and vertical lines that help the reader determine data point values in a chart. You can modify legends and gridlines at any time.

Add a Title

graphics/one_icon.jpg

Select a chart to which you want to add one or more titles.

graphics/two_icon.jpg

Click the Chart menu, click Chart Options, and then click the Titles tab.

graphics/three_icon.jpg

Type the text you want for the title of the chart.

graphics/four_icon.jpg

Type title text for the x-axis and y-axis.

graphics/five_icon.jpg

If you want a second line for the x-axis or y-axis, type the title text (if available).

graphics/six_icon.jpg

Click OK.

graphics/08inf35.jpg

Add or Delete a Legend

graphics/one_icon.jpg

Select the chart to which you want to add or delete a legend.

graphics/two_icon.jpg

Click the Legend button on the Chart toolbar. You can drag the legend to move it to a new location.

graphics/08inf36.jpg


Show Me. Microsoft Office 2003
Show Me Microsoft Office 2003
ISBN: 0789730073
EAN: 2147483647
Year: 2002
Pages: 418

flylib.com © 2008-2017.
If you may any questions please contact us: flylib@qtcs.net