Formatting a Chart

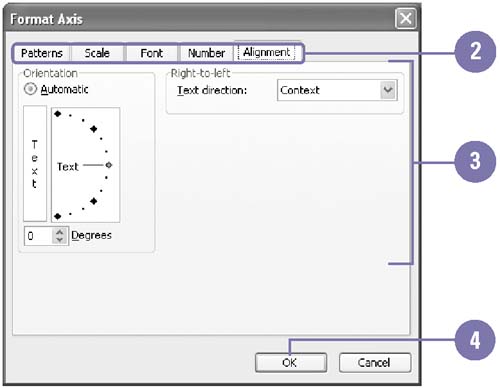
You can format or change any chart object ”such as titles, legends, gridlines, data labels, data tables, and text annotations ”to enhance the appearance of the chart and increase its overall effectiveness. A chart title identifies its purpose and axis titles identify the plotted data. Titles can be multiple lines and formatted like other worksheet text.

Format a Chart Object

graphics/one_icon.jpg

Double-click the chart element you want to format.

graphics/two_icon.jpg

Click the tab that corresponds to the type of change you want to make.

graphics/three_icon.jpg

Select the formatting options you want to change or apply.

graphics/four_icon.jpg

Click OK.

graphics/08inf33.jpg

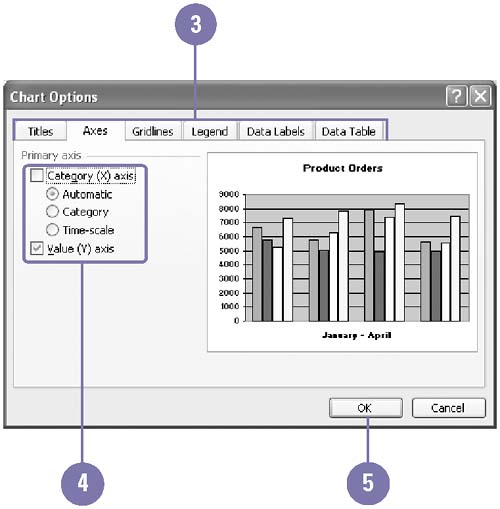
Change Chart Options

graphics/one_icon.jpg

Select a chart you want to change.

graphics/two_icon.jpg

Click the Chart menu, and then click Chart Options.

graphics/three_icon.jpg

Click the chart option tab (Titles, Axes, Gridlines, Legend, Data Labels, or Data Table) you want to change.

graphics/four_icon.jpg

Enter information, and then select the options you want.

graphics/five_icon.jpg

Click OK.

graphics/08inf34.jpg

Did You Know?

You can add a text annotation . A text annotation is separate text. Select the chart, type the annotation text, and then press Enter. You can drag the text box to a new location.


Show Me. Microsoft Office 2003
Show Me Microsoft Office 2003
ISBN: 0789730073
EAN: 2147483647
Year: 2002
Pages: 418

flylib.com © 2008-2017.
If you may any questions please contact us: flylib@qtcs.net