| You can format the text and appearance of an organization chart with the same tools you use for other PowerPoint objects. You can change the chart style, rearrange chart boxes, or edit names in the chart boxes to match the organization of the company. The current chart type appears in the traditional style, one manager at the top with subordinates below. You can use the AutoFormat button on the Organization Chart toolbar to change the chart style. You can also change the chart box color, shadow, border style, border color , or border line style by clicking commands on the Drawing toolbar. Remember to use formatting wisely and keep in mind the overall design of your presentation. Format an Organization Chart -
 | Click the org chart you want to format. | -
 | Click the chart object or objects you want to format. | -
 | Click the button on the toolbar you want to use. | -
Use the Formatting and Drawing toolbars to format the text in a chart box. -
Use the Drawing toolbar to change the color, shadow effect, border style, border color, and border line style of a selected chart box. -
Use the Drawing toolbar to format the lines that connect the chart boxes, including their thickness , style, and color. -
 | Make the formatting changes you want. | -
 | Click outside of the organization chart to deselect it. | 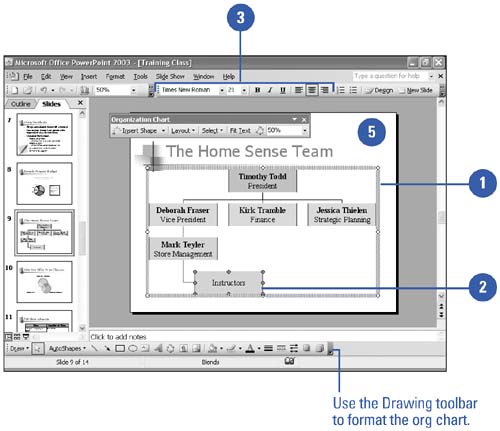 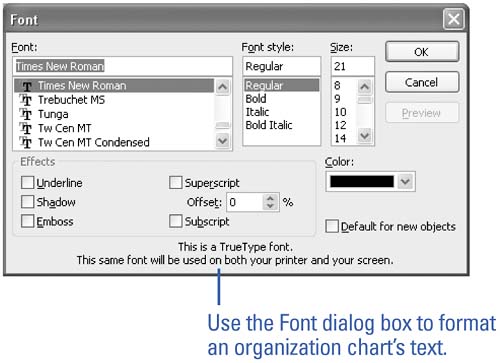 Did You Know? You can align text in a chart box . Align the text in a chart box by selecting text in the chart box, and then clicking the Left, Center, or Right button on the Formatting toolbar. | Change the Chart Style -
| | Click the org chart you want to change. | -
| | Click the AutoFormat button on the Organization Chart toolbar. | -
| | Select a Diagram Style from the Organization Chart Style Gallery. | -
| | Click OK. | 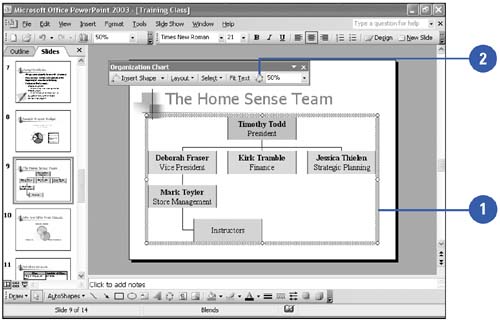 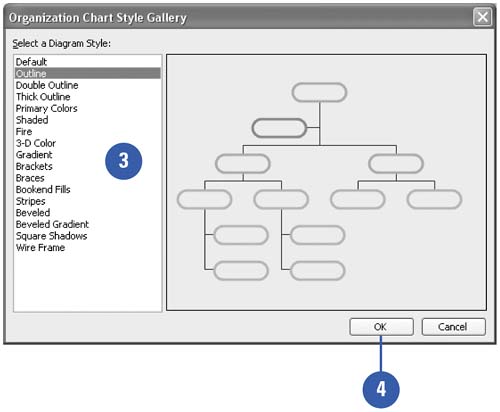 Did You Know? You can use the Default Chart Style when modifying . Format changes such as coloring and line style can only be made to the Default chart style, not the predesigned styles. |  |