Inserting a Microsoft Excel Chart

graphics/microsoftoffice13.gif

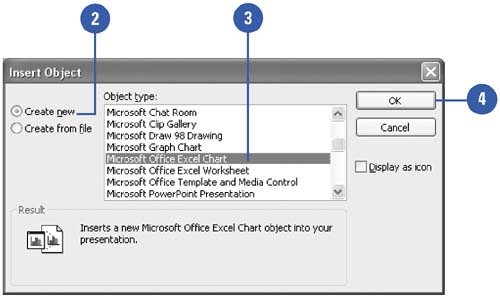
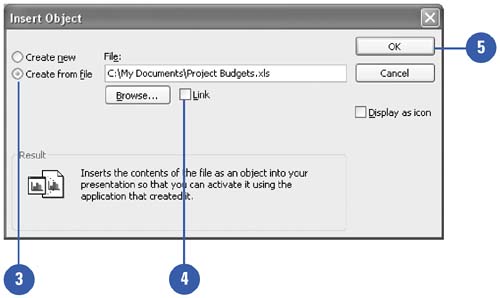
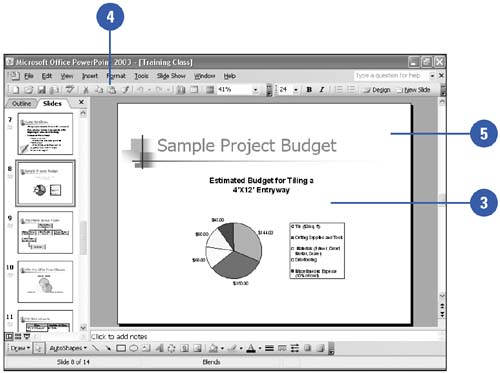
PowerPoint simplifies the process of inserting an Excel chart into a presentation by embedding the chart as an object in the slide. An embedded object is an object that maintains a direct connection to its original program, known as the source program. After you insert an embedded object, you can easily edit it by double-clicking it, which opens the program in which it was originally created. Embedding objects increases the file size of a presentation because the embedded object is stored in the presentation. To reduce the file size of the presentation, you can link an object instead of embedding it. A linked object appears in the slide, but it actually contains a "link" back to the original file, known as the source document. When you link an object, the original object is stored in its source document, where it was created. The presentation stores only a representation of the original. The source program will update the object when you modify the source document.

Insert a New Excel Chart

graphics/one_icon.jpg

Click the Insert menu, and then click Object.

graphics/tow_icon.jpg

Click the Create New option.

graphics/three_icon.jpg

Click Microsoft Office Excel Chart.

graphics/foure_icon.jpg

Click OK.

graphics/five_icon.jpg

Use the source program tools to edit the object.

graphics/six_icon.jpg

When you're done, click outside the object.

graphics/06inf35.jpg

Did You Know?

You can drag a chart from Excel to PowerPoint . Open both Excel and PowerPoint, select the chart in Excel, and then drag it into PowerPoint. If the PowerPoint presentation is not visible, drag the chart to the presentation button on the taskbar to display PowerPoint.

Import a Microsoft Excel Worksheet or Chart

graphics/one_icon.jpg

Display the slide on which you want to insert the Excel chart.

graphics/tow_icon.jpg

Click the Insert menu, and then click Object.

graphics/three_icon.jpg

Click the Create From File option, click the Browse button, locate and select the chart you want, and then click OK.

graphics/foure_icon.jpg

To link the chart, click the Link check box.

graphics/five_icon.jpg

Click OK.

graphics/six_icon.jpg

If necessary, edit the worksheet using the Excel tools.

graphics/seven_icon.jpg

Click outside the worksheet when you are finished.

graphics/06inf36.jpg

Copying and Pasting an Existing Excel Chart

graphics/one_icon.jpg

Open the worksheet containing the chart in Excel.

graphics/tow_icon.jpg

Click the chart, and then click the Copy button on Excel's Standard toolbar.

graphics/three_icon.jpg

Switch to PowerPoint and open the slide on which you want to add the chart.

graphics/foure_icon.jpg

Click the Paste button on the Standard toolbar.

graphics/five_icon.jpg

Click outside the chart to deselect it.

graphics/06inf37.jpg


Show Me Microsoft Office PowerPoint 2003
Show Me Microsoft Office PowerPoint 2003 (Show Me Series)
ISBN: 078973009X
EAN: 2147483647
Year: 2002
Pages: 271

flylib.com © 2008-2017.
If you may any questions please contact us: flylib@qtcs.net