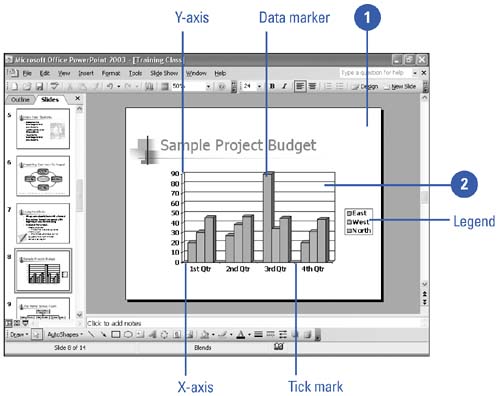
Opening an Existing Graph Chart

Like any inserted object, you can open an existing chart in PowerPoint by double-clicking it. Then you can make any changes you want using the Graph commands and toolbars . Close the datasheet to view the chart.

Open and View a Chart in Microsoft Graph

graphics/one_icon.jpg

In PowerPoint, display the slide that contains the chart you want to open.

graphics/tow_icon.jpg Double-click the chart to start Microsoft Graph.

The Datasheet and Graph toolbars and menus appear.

graphics/three_icon.jpg Click the View Datasheet button on the Standard toolbar to close the datasheet.

A chart consists of the following elements.

  • Data markers . A graphical representation of a data point in a single cell in the datasheet. Typical data markers include bars, dots, or pie slices. Related data markers constitute a data series.

  • Legend . A pattern or color that identifies each data series.

  • X-axis . A reference line for the horizontal data values.

  • Y-axis . A reference line for the vertical data values.

  • Tick marks . Marks that identify data increments .

graphics/06inf03.jpg


Show Me Microsoft Office PowerPoint 2003
Show Me Microsoft Office PowerPoint 2003 (Show Me Series)
ISBN: 078973009X
EAN: 2147483647
Year: 2002
Pages: 271

flylib.com © 2008-2017.
If you may any questions please contact us: flylib@qtcs.net