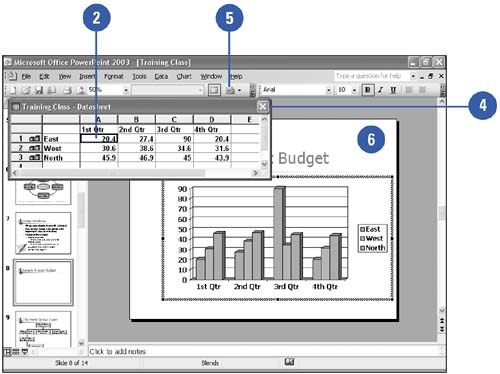
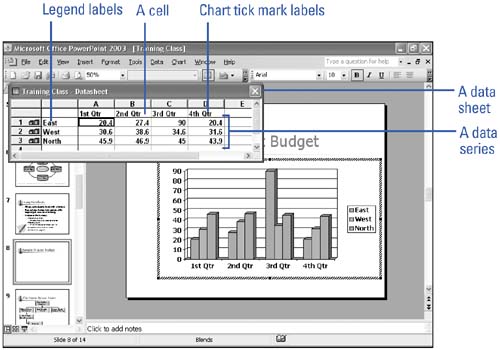
Inserting a Graph Chart

graphics/microsoftoffice14.gif

Instead of adding a table of dry numbers , insert a Microsoft Graph chart. Charts add visual interest and useful information represented by lines, bars, pie slices, or other markers. Graph uses two views to display the information in a graph: the datasheet , a spreadsheet-like grid of rows and columns that contains your data, and the chart , the graphical representation of the data. A datasheet contains cells to hold your data. A cell is the intersection of a row and column. A group of data values from a row or column of data makes up a data series . Each data series has a unique color or pattern on the chart.

Create a Graph Chart

graphics/one_icon.jpg

Start Microsoft Graph in one of the following ways.

  • To create a graph on an existing slide, display the slide on which you want the graph to appear, and then click the Insert Chart button on the Standard toolbar.

  • To create a graph on a new slide, click the New Slide button on the Formatting toolbar, choose a slide layout with the content or chart option from the Slide Layout task pane, and then click the chart placeholder to add the chart and datasheet.

graphics/tow_icon.jpg

Replace the sample data in the datasheet with your own data.

graphics/three_icon.jpg

Edit and format the data in the datasheet as appropriate.

graphics/foure_icon.jpg

Click the Close button on the datasheet to close it and view the chart.

graphics/five_icon.jpg

If necessary, change the chart type, and format the chart.

graphics/six_icon.jpg

Click outside the chart to quit Microsoft Graph.

graphics/06inf01.jpg

graphics/06inf02.jpg


Show Me Microsoft Office PowerPoint 2003
Show Me Microsoft Office PowerPoint 2003 (Show Me Series)
ISBN: 078973009X
EAN: 2147483647
Year: 2002
Pages: 271

flylib.com © 2008-2017.
If you may any questions please contact us: flylib@qtcs.net