10.2 Visualizing Concurrent Behavior
| The behavioral view of a system focuses on the dynamic aspects of that system. This view examines how the elements in the system behave as it interacts with other elements of the system. Here is where concurrency will emerge as elements interact with other elements. The diagramming techniques discussed in this section are the ones used to model:
This section also covers diagraming techniques used to model distributed objects. 10.2.1 Collaborating ObjectsCollaborating objects are objects involved with each other to perform some specific task. They do not form a permanent relationship. The same objects can be involved with other objects working together to perform other tasks . Collaborating objects can be represented in a collaboration diagram . Collaboration diagrams have a structural part and an interactive part. The structural part has already been discussed. The interaction part is a graph where all of the participating objects are vertices. The connections between the objects are the arcs. The arcs can be adorned with messages passed between the objects, method invocations, and stereotype indicators that express more details about the nature of the connection. The connection between two objects is a link . A link is a type of association. When two objects are linked, actions can be performed between them. The action may result in a change of the state of one or both objects. These are examples of the types of actions that can take place:
When any method is invoked, the parameters and the return value can be expressed . Other actions can take place if specified. These actions can take place if the receiving object is visible to the calling object. Stereotypes can be used to specify why the object is visible:
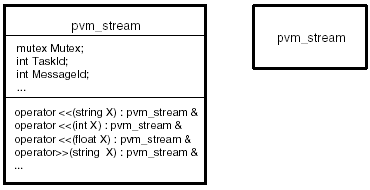
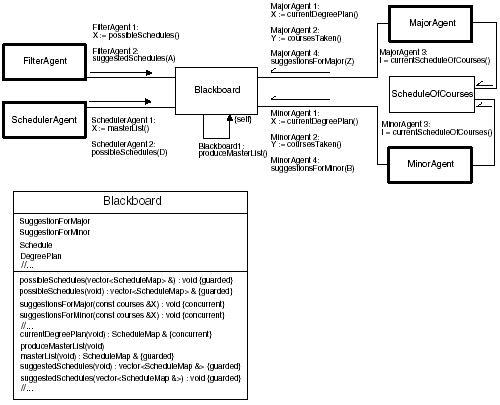
Other stereotypes and adornments appropriate for associations can be expressed. When a method is invoked, this may cause a number of other methods to be invoked by other objects. The sequence in which the operations are performed can be shown by using a sequence number combination and a colon separator prepended to the method. The sequence number combination expresses what sequence the method is associated with and the time order number in which the operation takes place. For example, Figure 10-7 shows a collaboration diagram that uses the sequence numbers . Figure 10-7. A collaboration diagram using sequence numbers. In Figure 10-7, MainObject performs two operations in sequence: 1: <<create>> 2: Value := performAction(ObjectF) In operation 1 , MainObject creates ObjectA . ObjectA is local to the MainObject by containment. This initiates the first sequence of operations in a nested flow of control. All operations apart from this sequence use the number 1 followed by the time order number in which the operation takes place. The first operation of sequence 1 is: 1.1: initialize() ObjectA invokes its own operation. This is expressed by linking the object to itself and by using the {self} stereotype indicator. The ObjectA::initialize() operation also causes the beginning of another sequence of actions: 1.1.1: initializeB() 1.1.2: initializeC() in which two other objects local to ObjectA initialize methods are called. The operation: 2: performAction(ObjectD) is the beginning of another nested sequence. ObjectD is passed to ObjectA . ObjectA invokes ObjectD 's operation: 2.1: doAction() ObjectA can invoke this operation because ObjectD is a parameter (passed by MainObject ), as the stereotype {parameter} indicates. A value is returned to ObjectA and a value is returned to MainObject . Besides sequence number combinations, these nested flows of control are further enhanced by using a line with a solid arrowhead pointing in the direction of the flow of the sequence. 10.2.1.1 Processes and ThreadsA process is a unit of work created by the operating system. It has one or more flows of control executing within its address space. Each process has at least one thread, the main thread, but can have many threads executing within its address space. Each thread represents a process's flow of control. Multiple processes can execute concurrently. Threads within the address space of a process can execute concurrently with threads of other processes. When using the UML, each independent flow of control is considered an active object . An active object is an object that owns a process or thread. Each active object can initiate control activity. An active class is a class whose objects are active. Active classes can be used to model a group of processes or threads that share the same data members and methods. The objects of your system may not have a one-to-one correlation with active objects. As discussed in Chapters 3 and 4, when dividing your program up into processes and threads along object lines, an object's methods may execute in a separate process or execute on separate threads. Therefore, when modeling such an object, it may be represented by several active objects. This relationship between static and active objects can be represented by using an interaction diagram. Your system may have several PVM or MPI tasks or processes. Each of them can be represented directly as an active object. The UML represents an active object or class the same way a static object is represented, except it has a heavier line tracing the perimeter of the rectangle. Two stereotypes can also be used: process thread These stereotype indicators can be displayed to show the distinction between the two types of active objects. Figure 10-8 shows a PVM task as an active class and an active object. A collaboration diagram can consist of active objects. Figure 10-8. An active object and class. 10.2.1.2 Showing the Multiple Flows of Control and CommunicationIn a concurrent and distributed system, there will be multiple flows of control. Each flow of control is based on a process or a thread controlling the activity. These processes and threads may be executing on a single computer system with multiple processors or the processes may be distributed among several different computers. An active object or class is used to represent each flow of control. When the active object is created, an independent flow of control is initiated. When the active object is destroyed, the flow of control is terminated . Modeling the multiple flows of control in your system will help in the management, synchronization, and communication between them. In a collaboration diagram, sequence numbers and solid arrows are used to identify flows of control. In a collaboration diagram that consists of active objects in a concurrent system, the name of the active object is preprended to the sequence numbers of the operations peformed by the active object. Active objects can invoke methods in other objects and suspend execution until the function returns or can continue to execute. Arrows are used not to just show the direction of the flow of control but the nature of it. A solid arrowhead is used to represent a synchronous call and a half-stick arrowhead is used to represent an asynchronous call. Since more than one active object can invoke the operation of a single object, the method properties: sequential guarded concurrent can be used to describe the synchronization property of that method. Figure 10-9 shows a collaboration of several active objects. In this diagram, these objects are working together to produce a student schedule. The blackboard object is used to record and coordinate the preliminary work and resultant schedule produced by the active object problem solvers, in this case called agents : Figure 10-9. A collaboration diagram of static and active objects in the course adviser system.
The schedule_of_courses object contains all the courses available. The blackboard and schedule_of_courses objects are accessed concurrently by several agents. Both objects are visible to all the agents in this collaboration. The MajorAgent , MinorAgent , FilterAgent , and ScheduleAgent invoke methods of the blackboard object. MajorAgent and MinorAgent invoke methods of the schedule_of_courses object. MajorAgent and MinorAgent have a similar sequence of calls to the blackboard and schedule_of_courses objects:
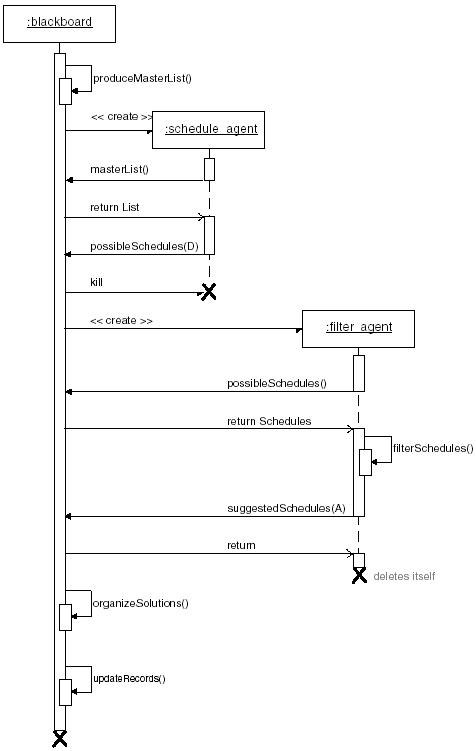
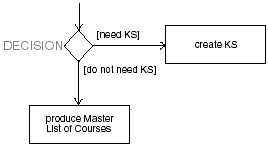
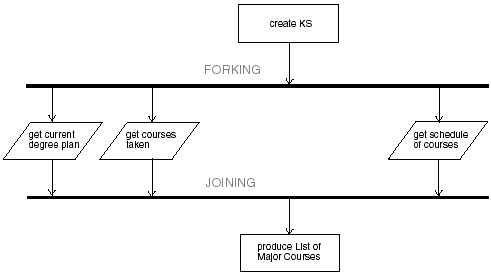
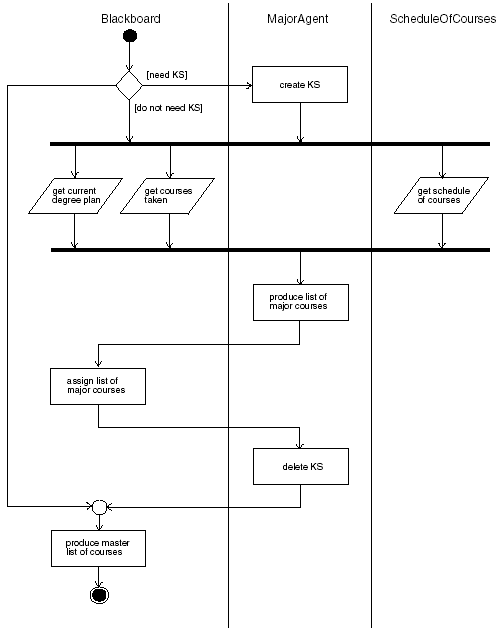
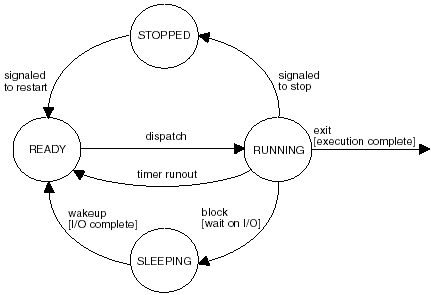
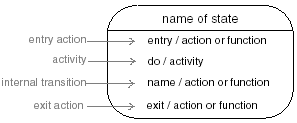
As you can see, the name of the active object that invokes these operations are prepended to the sequence number. Both objects are concurrently invoking blackboard and schedule_of_courses operations. All these operations have concurrent synchronization and are safe to call simultaneously . masterList() and possibleCourses() have a guarded property. The objects supplying these courses may be writing them as these objects are attempting to read them. They are guarded by only allowing sequential access (EREW). 10.2.2 Message Sequences between ObjectsWhere a collaboration diagram focuses on the structural organization and interaction of objects working together to perform a task, operation, or realize a use case, a sequence diagram focuses on the time ordering of method invocation or procedures involved in a particular task, operation, or use case. In a sequence diagram, the name of each object or construct involved is displayed in its own rectangular box. The boxes are placed at the top along the x-axis of the diagram. You should only include the major players involved and the most important function calls because the diagram can quickly become too complicated. The objects are ordered from left to right starting from the object or procedure that initiates the action to the most subordinate objects or procedures. The calls are placed along the y-axis from top to bottom in time order. Vertical lines are placed under each box representing the lifeline of the object. Solid arrowhead lines are drawn from the lifeline of one object to the lifeline of another representing a function call or method invocation from the caller to the receiver. Stick arrowhead lines are drawn from the receiver back to the caller representing a return from a function or method. Each function call is labeled at the minimum with the function or method name. The arguments and control information, like the condition in which the method is invoked, can also be displayed. For example: [list != empty] getResults() The function or method will not be performed unless the condition is true. Methods that are to be invoked several times on an object, like reading values from a structure, are preceded by an iteration marker ( * ). Figure 10-10 shows a sequence diagram of some of the objects involved in the course adviser system. Only some of the objects are shown to avoid a complicated diagram. When using the sequence diagram for concurrent objects or procedures, activation symbols are used. An activation symbol is a rectangle that appears on the object's lifeline. This indicates the object or procedure is active. These are used when an object makes a call to another object or procedure and does not block. This shows that the object or procedure is continuing to execute or be active. In Figure 10-10, the blackboard object is always active. It spawns a schedule_agent object and does not block. The schedule_agent calls blackboard.masterList() and waits for the method to return the list of courses. A return arrow is used to indicate the method has returned. The schedule_agent then calls one of its own methods createSchedules() . To indicate an object has called one of its own methods, a self-delegation symbol is used. This is a combination of an activation symbol and a call arrow. An activation symbol is overlapped on the existing activation symbol. A line proceeds from the original activation symbol with an arrow pointing to the added activation symbol. Once schedule_agent posts its results by calling blackboard.possible -Schedule(), the blackboard object kills it. This is indicated with the large X at the end of its lifeline. A call arrow from the blackboard object points to this X , indicating it has killed the object. The blackboard object spawns a filter_agent object and does not block. The filter_agent calls blackboard.possibleSchedules() and waits for the method to return the schedules. The filter_agent then calls one of its own methods filterCourses() . Once filter_agent posts its results, it deletes itself. The blackboard object calls its own organizeSolution() and updateRecords() then deletes itself. Figure 10-10. A sequence diagram of some of the objects involved in the course adviser system. 10.2.3 The Activities of ObjectsThe UML can be used to model the activities performed by objects involved in a specific operation or use case. This is called an activity diagram . It is a flowchart showing the sequential and concurrent actions or activities involved in a specific task, step-by-step. The arrows trace the flow of control for the activities represented in the diagram. Collaboration diagrams emphasize the flow of control from object to object, sequence diagrams emphasize the flow of control in time order, and the activity diagram emphasizes the flow of control from one action or activity to another. The actions or activities change the state of the object or returns a value. The containment of the action or activity is called an action or activity state . They represent the state of the object at a particular instant in the flow of control. Actions and activities differ . Actions cannot logically be decomposed or interrupted by other actions or events. Examples of actions are creating or destroying an object, invoking an object's method, or calling a function in a procedure. An activity can be decomposed into other activities or even another activity diagram. An example of an activity is a program, a use case, or a procedure. Activities can be interrupted by an event or other activities or actions. An activity diagram is a graph in which the nodes are actions or activities and the arcs are triggerless transitions. Triggerless transitions require no event to cause the transition to occur. The transition occurs when the previous action or activity has completed. The diagram comprises decision branches, starts, stops, and synchronization bars that join or fork several actions or activities. Both action and activity states are represented the same way. To represent an action or activity state, the UML uses the standard flowchart symbol used to show the enter and exit point of the flowchart. This symbol is used regardless of the type of action or activity occurring. We prefer to use the standard flowchart symbols that distinguish input/output actions (parallelogram) from processing or transformation actions (rectangle). The description of the action or activity as a function call, expression, phrase, use case, or program name is displayed in the action symbol used. An activity state may in addition show the entry and/or exit action. The entry action is the action that takes place when the activity state is entered. The exit action is the action that takes place just before exiting the activity state. They are the first and last actions to be executed in the activity state, respectively. Once an action has completed, a transition occurs in which the next action takes place immediately. The transition is represented as a directed line from one state with a stick arrow pointing to the next state. A transition pointing to a state is inbound and a transition leading from a state is outbound. Before the outbound transition occurs, the exit action, if it exists, executes. After an inbound transition, the entry action for the state, if it exists, executes. The start of the flow of control is represented as a large solid dot. The first transition leads from the solid dot to the first state in the diagram. The stopping point or stop state of the activity diagram is represented as a large solid dot inside a circle. Activity diagrams, like flowcharts, have a decision symbol. The decision symbol is a diamond with one inbound transition and two or more outbound transitions. The outbound transitions are guarded conditions that determine the path of the flow of control. The guarded condition is a simple boolean expression. All of the outbound transitions should cover all of the possible paths from the branch. Figure 10-11 shows the decision symbol used in determining whether a knowledge source should be constructed . Figure 10-11. The decision symbol used in determining whether a knowledge source should be constructed. You may find that there exists more than one flow of a sequence of actions or activities occurring concurrently after an action or activity has completed. Unlike a flowchart, the UML defines a symbol that can be used to represent the instant where multiple flows of control occur concurrently. A synchronization bar is used to show where a single path branches off or forks into parallel paths and where parallel paths join. It is a thick horizontal line in which there can be multiple outbound transitions (forking) or multiple inbound transitions (joining). Each transition represents a different path. Outbound transitions from a synchronization bar signify an action or activity state has caused multiple flows of control to occur. Inbound transitions into a synchronization bar signify the multiple flows of control need to be synchronized. A synchronization bar is used to show the paths are waiting for all paths to meet and join into a single flow or path. Figure 10-12 shows an example of forking and joining. Figure 10-12. An example of forking and joining from or to the synchronization bar. In Figure 10-12, creating MajorAgent invokes its constructor, which forks three flows of control. After these three actions have completed, they are joined again into a single flow of control in which the action "produce list of major courses" is executed. The diagram can be divided into separate sections called swimlanes . In each swimlane, the actions or activities of a particular object, component, or use case occurs. Swimlanes are vertical lines that partition the diagram into sections. A swimlane for a particular object, component, or use case specifies the focus of activities. An action or activity can only occur in a single swimlane . Transitions and synchronization bars can cross one or more swimlanes. Actions or activities in the same lane or different lanes but at the same level are concurrent. Figure 10-13 shows the activity diagram with swimlanes. Figure 10-13. An activity diagram with swimlanes showing a sequence of actions in the course advisor system. The purpose of this activity diagram is to model the sequence of actions involved in a blackboard object producing the master list for our course adviser system. In Figure 10-13, the blackboard object first makes the decision whether the MajorAgent object should be constructed. If so, the constructor for MajorAgent is invoked. This causes a fork of three flows of control. Two of the actions are executed by the blackboard object, "get current degree plan" and "get courses taken," and one action is executed by the ScheduleofCourses object, "get schedule of courses." These are all input actions, as the symbol represents. The multiple paths are joined again and MajorAgent performs an action "produce list of major courses." The blackboard performs an action "receive list of major courses" followed by the deletion of the MajorAgent object. The blackboard object "produces master list of courses," then the activities stop. 10.2.4 State MachinesState machines depict the behavior of a single construct specifying the sequence of transformations during its lifetime as it responds to internal and external events. The single construct can be a system, a use case, or an object. State machines are used to model the behavior of a single entity. An entity can respond to events such as procedures, functions, operations, and signals. An entity can also respond to elapses in time. Whenever an event takes place, the entity responds by performing some activity or taking some action resulting in a change of the state of the entity or the production of some artifact. The action or activity performed will depend upon the current state of the entity. A state is a condition the entity is in during its lifetime as a result of performing some action or responding to some event. A state machine can be represented in a table or directed graph called a state diagram . Figure 10-14 shows a UML state diagram for the state machine of a process. Figure 10-14 shows the states some process progresses go through while it is active in the system. The process can have four states: ready, running, sleeping, and stopped . There are eight events that cause the four states of the process. Three of the events only occur if a condition is met. The block event occurs only if the process requests I/O or it is waiting for an event to occur. If the block event occurs, it triggers the process to transform from a running state to a sleeping state. The wakeup event occurs only if the event takes place or the I/O has been completed. If the wakeup event occurs, it triggers the process to transform from a sleeping state (source state) to a ready state (target state). The exit event occurs only if the process has executed all its instructions. If the exit event occurs, it triggers the process to transform from a running state to a sleeping state . The remaining events are external events and not under the control of the process. They occur for some external reason triggering the process to transform from a source to a target state. Figure 10-14. State diagram for processes. The state diagrams are used to model the dynamic aspects of an object, use case, or system. The sequence, activity, and interactive collaboration diagrams and now the state diagram are used to model the behavior of the system or object when it is active. Structural collaboration and class diagrams are used to model the structural organization of an object or system. State diagrams are good to use to describe the behavior of an object regardless of the use case. They should not be used to describe the behavior of several interacting or collaborating objects. They should be used to describe the behavior of an object, system, or use case that goes through a number of transformations and more than one event may cause a single transformation to occur. These are constructs that are very reactive to internal and external events. In the state diagram, the nodes are states and the arcs are transitions. The states are represented as rounded-corner rectangles in which the name of the state is displayed. The transitions are lines connecting the source and target states with a stick arrow pointing to the target state. There are initial and final states . The initial state is the default starting point for the state machine. It is represented as a solid black dot with a transition to the first state of the state machine. The final state is the ending state of the state machine, indicating it has completed or the system, use case, or object has reached the end of its lifeline. It is represented as a solid dot embedded in a circle. Table 10-5. Parts of a State
A state has several parts. Table 10-5 lists the parts of a state. A state can be represented simply by displaying the name of the state at the center of the state symbol. If other actions are to be shown inside the state symbol, the name of the state should appear at the top in a separate compartment. The actions and activities are listed below this compartment and are displayed in this format: label [Guard] / action or activity For example: do / validate(data) The do is the label used for an activity to be performed while the object is in this state. The validate(data) function is called with data as the argument. If an action or activity is a call to a function or method, the arguments can be displayed. The Guard is an expression that evaluates to true or false. If a condition evaluates to true, the action or activity takes place. For example: exit [data valid] / send(data) The exit action send(data) is guarded. The expression data valid is evaluated to be true or false. Upon exiting the state, if the expression is true, then the send(data) function is called. The Guard is always optional. Transitions occur when an event takes place. This causes the object, system, or use case to transform from one state to another. There are two transitions that can occur that does not cause a change in the state of the object, system, or use case: self-transition and internal transition. With a self-transition, when a particular event occurs, this triggers the object to leave the current state. When exiting, it performs the exit action (if any), then performs whatever action is associated with the self-transition (if any). The object reenters the state and the entry action (if any) is performed. With an internal transition, the object does not leave the state and therefore no entry or exit actions are performed. Figure 10-15 shows the general structure of a state with exit and entry actions, do activity along with internal and self-transitions. A self-transition is represented as a directed line that points back to the same state. Figure 10-15. The general structure of a state with an exit action, entry action, do activity, and internal “ self-transitions. A transition between different states indicates that there is a relationship or path that exists between them. From one state an event can occur or a condition can be met that causes the object to be transformed from one state (source state) to another state (target state). The event triggers the transition of the object. A transition may have several concurrently existing source states. If so, they are joined before the transition occurs. A transition may have several concurrently existing target states in which a fork has occurred. Table 10-6 lists the parts of a transition. A transition is rendered as a directed line from the source state pointing to the target state. The name of the event trigger is displayed next to the transition. Like actions and activities, events for transitions can also be guarded. A transition can be triggerless, meaning no special event occurs that causes the transition to take place. Exiting the source state, the object immediately makes the transition and enters the target state. Table 10-6. Parts of a Transition
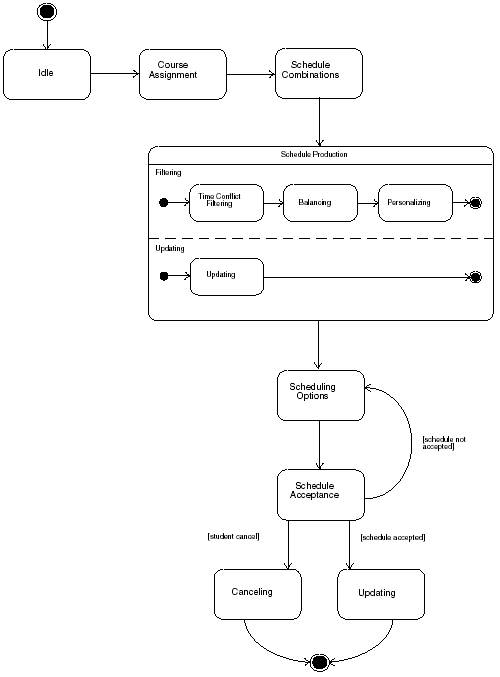
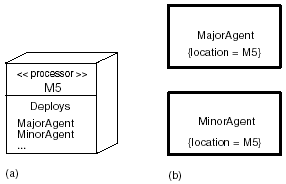
10.2.4.1 Concurrent SubstatesA substate can be used to further simplify the depiction of modeling the behavior of a concurrent system. A substate is a state contained inside another state called a superstate or composite state . This representation means a state can be further broken down into one or more substates. These substates can be sequential or concurrent. With concurrent substates, each state machine represented exists in parallel as different but concurrently existing flows of control. This means the object is engaged in two independent sets of behavior. This is true for our blackboard object. As it is processing each possible schedule, it has to also update its appropriate structures and perform other maintenance. Each substate is contained in a separate compartment. The substates are synchronized and joined before exiting the composite state. When one substate has reached its final state, it waits for the other state to reach its final state, then the substates are joined back into one flow. Figure 10-16 shows a state diagram for the blackboard object that produces a student schedule. Figure 10-16. State diagram for the blackboard object. In Figure 10-16, the schedule production is a composite state. It has concurrent substates called filtering and maintenance . Each substate is separated by a dashed line and is represented by its own state machine, each having an initial and final state. In the filtering substate, the object goes through the time conflict filtering, balancing, and then personalizing states. In the maintenance substate, the object goes through one state: updating. When both substates have reached their final states, filtering and maintenance are joined before exiting the composite state schedule production. 10.2.5 Distributed ObjectsDistributed objects are objects executing on different processors on different machines. A deployment diagram is used to model the view of the system that shows the physical relationships between the software and hardware components in the delivered system. They are used to show how the components and objects are routed in the distributed system. Components can be executable programs, libraries, or databases. You may want to specify where a particular component or object resides in the system. Determining how to distribute the concurrent components of your system will be difficult. Modeling how the components are distributed will help in managing the configuration, functionality, and throughput of the system. A deployment diagram consists of nodes and the objects or components that reside on the nodes. A node is a computational unit or a piece of hardware that has some memory and processing capability, whether it be a device, a computer, a mainframe, or a cluster of computers. The nodes are related by dependency. These dependencies represent how the components communicate with each other. The direction of the dependency indicates which component is aware of the other component. Even if there is communication in both directions, one component may not be aware of whom they are communicating with. There are two ways to model the location of components or objects in a UML deployment diagram: nesting or tagged value. They reflect the approach of listing the components that reside on a node in the node symbol or displaying the location of the components in the component symbol. Nodes are a part of a deployment diagram. The node symbol is a cube. The cube can have two separate compartments: one contains the stereotype indicator describing the type of node and the other contains the list of components that reside on that node. The approach uses the component symbol and displays a location tag assigning the name of the node where the component resides. A location tag has this format: {location = name of node} The location tag can be a part of any diagram in which the location of the component is appropriate (e.g., collaboration, object, or activity diagram). Figure 10-17 shows the two approaches of showing the location components in a distributed system. In Figure 10-17, (a) shows the node symbol listing the components that reside on it and (b) shows the active object symbol using the location tag. Figure 10-17. Approaches to show the location of a component in a distributed system. |
EAN: 2147483647
Pages: 133
- ERP Systems Impact on Organizations
- The Second Wave ERP Market: An Australian Viewpoint
- Enterprise Application Integration: New Solutions for a Solved Problem or a Challenging Research Field?
- A Hybrid Clustering Technique to Improve Patient Data Quality
- Relevance and Micro-Relevance for the Professional as Determinants of IT-Diffusion and IT-Use in Healthcare

