Exercise 4-1: Building an Executive Dashboard
Exercise 4-1: Building an Executive Dashboard
Key Performance Indicators (KPI) are measurements that indicate the state of an organization. KPIs can either present data from the past (revenue from the previous quarter) or they can predict into the future (likely number of units that will sell in the Southeast). Both types of KPIs have value to managers running the organization; however, most managers have a difficult time getting access to KPIs. In this exercise, you will create an Executive Dashboard that presents some mock KPIs using a SharePoint site created with Microsoft FrontPage.
Preparing Data Sources
Although SharePoint sites are excellent for presenting information to end users, you must still do the work necessary on the back end to provide appropriate data sources for SharePoint Services to access. Sites built with Microsoft FrontPage can use several different kinds of data sources, including XML, SQL databases, and web services. In this exercise, you will make use of some different data sources, including direct access to SQL databases, Microsoft Excel spreadsheets, and SQL XML.
The concept of making services available remotely across the Internet is now affecting nearly every aspect of the enterprise. The same is true with SQL Server. SQL Server 2000 supports directly accessing databases through HTTP using SQL XML. This means that you can make SQL calls directly from a browser.
In order to set up SQL Server to deliver data over the web, you must first configure a virtual directory for clients to access. Interestingly, your installation of SharePoint Services has a global impact on the SPSPortal server. This means that SharePoint Services has really taken over the entire web site where it was installed. Therefore, you first have to create a new web site for the client to access the functions of SQL XML.
To create a new web site, follow these steps:
-
Log in to SPSPortal as the local administrator.
-
Select Start Administrative Tools Internet Information Services (IIS) Manager.
-
In the IIS Manager, expand the tree until the Web Sites folder is visible.
-
Right-click the Web Sites folder and select New Web Site. This starts the web site wizard.
-
In the Description text box, type SQLXML and click Next .
-
In the "TCP port this Web site should use (Default 80)" text box, type 8080 and click Next.
-
Click Browse to search for a new directory.
-
In the Browse for Folder dialog select the root of the C: drive and click Make New Folder.
-
Name the new folder SQLXML Web and click OK.
-
Finish the rest of the wizard to create the new web site.
-
In the IIS Manager, click the Web Service Extensions folder.
-
Select the web service extension All Unknown ISAPI Extensions and click Allow.
-
Close the IIS Manager.
Once the new web site is created, you must now create a virtual directory beneath the new web site. The virtual directory will act as the access point for the SQL Server data. You will utilize existing data from the Northwind database for your exercise.
Here is what you will do to create a virtual directory:
-
Select Start All Programs Microsoft SQL Server Configure SQL XML Support in IIS.
-
In the IIS Virtual Directory Manager, expand the tree until the SQLXML web site is visible.
-
Right-click the SQLXML web link and select New Virtual Directory; this opens the New Virtual Directory Properties dialog.
-
On the General tab, name the new virtual directory Northwind .
-
Under the Local Path section, click Browse. Browse to the SQLXML Web folder you created earlier and select it.
-
Click Make New Folder and create a directory underneath named Northwind .
-
Click OK.
-
On the Security tab, enter credentials that will be used to log in to SQL Server.
Note If you use Windows Integrated Security, you will need to give permissions to access the folder you created on the General tab. This is because you created a new web outside of the default web site.
-
On the Data Source tab, select the Northwind database.
Note If you use Windows Integrated Security, you will need to give appropriate permissions to access the Northwind database.
-
On the Settings tab, check the box "Allow sql= or template= URL queries." Uncheck any other boxes.
-
Click OK to exit the property sheet.
-
Test the setup by logging into SPSClient and opening Internet Explorer.
-
In the browser, type the following URL:
http://spsportal:8080/northwind? sql=select*fromcategoriesforxmlauto&root=data
Building the Team Site
Now that the data sources are prepared for use, you can move on to creating the site itself. In this part of the exercise, you will use Microsoft FrontPage to create a new SharePoint Services site. This site will use different data sources to present KPIs in a dashboard format. After you create the site, you will make it accessible from SPS.
To create a new team site, follow these steps:
-
Log in to SPSClient as the administrator.
-
Once logged in, select Start All Programs Microsoft Office Microsoft Office FrontPage 2003.
-
In FrontPage, select File New. This opens the New pane.
-
In the New pane, select New Web Site SharePoint Team Site.
-
In the Web Site Templates dialog, select the General tab.
-
On the General tab, select to create a new SharePoint Team Site.
-
Specify the location of the new site as http://spsportal/ExecutiveDashboard .
-
Click OK.
-
When the new site is created, select View Folder List to display the site contents.
-
In the folder list, right-click default.aspx and select Open from the pop-up menu. This makes the page appear in design view.
-
In the designer, change the name of the web site by highlighting the text Team Web Site and changing it to Executive Dashboard.
Adding the Data Sources to the Catalog
Using the folder list, you can explore the contents of the new site. You notice that the new site is identical to one that you create in SPS using the Team Site template; however, you have much more control over the layout and functionality of the site when you edit it in FrontPage. Specifically, you can add custom data sources that are not available in SPS.
-
Select Data Insert Data View to open the Data Source Catalog.
-
In the Data Source catalog, expand the Database Connections node.
-
Click the Add to Catalog link underneath the node to open the Data Source Properties dialog.
-
On the Source tab, click the Configure Database Connection button.
-
In the Configure Database Connection dialog, type spsportal in the Server Name text box.
-
In the Authentication section, select "Save this username and password in the data connection." Type valid credentials into the User Name and Password boxes.
Note It is not a best practice to save the credentials in the data connection. Normally, you would use the Microsoft Single Sign-On (SSO) service or Windows authentication. I cover the SSO later in the book.
-
Click Next.
-
Select the Northwind database from the drop-down list of databases.
-
Select the Sales By Category view.
-
Click Finish to return to the Data Source Properties dialog.
-
Click the Fields button.
-
In the Displayed Fields dialog, remove the CategoryID field from the list of displayed fields.
-
On the General tab, name the connection Overall Category Sales .
-
Click OK.
-
Click OK again to exit.
-
Verify that you have typed the query correctly by opening the drop-down menu associated with the new connection and selecting Show Data.
Along with traditional direct connections to the database, you can also make use of the SQL XML connection to return data. These connections are made under the Server-Side Scripts section.
-
In the Data Source Catalog expand the Server-Side Scripts node.
-
Click the Add to Catalog link beneath the node to open the Data Source Properties dialog.
-
In the URL box, type the following URL:
http://spsportal:8080/northwind? sql=select*from[CategorySalesfor1997]forxmlauto&root=summary
-
On the General tab, name the connection Category Sales for 1997 .
-
Click OK.
-
Verify that you have typed the query correctly by opening the drop-down menu associated with the new connection and selecting Show Data.
Creating the Data Views
Once the data sources have been added to the catalog, you can use them to create content for the management dashboard. In this section of the exercise, you will clean up the default page and then add the new content. You'll create both tables and charts for the dashboard.
-
In design view, select each web part on the page and delete it by right-clicking and selecting Cut from the pop-up menu. You should have two empty zones remaining: Left and Right.
-
With the Data Source Catalog open, carefully drag the connection labeled Overall Category Sales onto the page; drop it onto the left Web Part Zone. A data table will appear as a result.
-
In the upper-left corner of the data table, locate the arrow used to access the Data View Options drop-down menu and click it. Figure 4-18 shows the arrow.
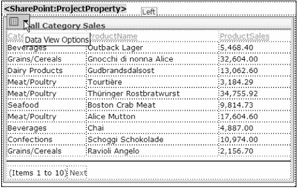
Figure 4-18: Accessing the Data View Options menu -
Select Data View Options Sort and Group .
-
Select to sort the data by CategoryName.
-
Click OK.
-
Carefully drag the connection labeled Category Sales for 1997 and drop it onto the right Web Part Zone.
Once both of the data views are in the page, you can connect them to make them more effective. In this exercise, you will connect the Category Sales for 1997 web part to the Overall Category Sales web part. In this way, you can filter the larger data set by using the smaller data set. This is a typical master-detail relationship between web parts .
-
In the right Web Part Zone, select the Category Sales for 1997 web part.
-
Select Data Web Part Connections from the FrontPage menu. This starts the Web Part Connections wizard.
-
In the first step, accept the default value of Provide Data Values To and click Next.
-
In the next step, accept the default value of "Connect to a web part on this page" and click Next.
-
In the next step, accept the default values for Target Web Part and Target Action. Click Next.
-
In the next step, choose to filter on CategoryName by selecting it from both columns and clicking Next.
-
In the next step, accept the default value of "Create a hyperlink on CategoryName" and click Next.
-
Click Finish.
-
Select File Save to save your work.
-
In the folder list, right-click default.aspx and select Preview in Browser from the pop-up menu. Verify the filter behavior by clicking hyperlinks in the category list.
Along with data sources and web parts, you can also use server-side web components to display data. Web components allow you to access other interesting sources of data, such as Excel spreadsheets, and incorporate them into the page. In this section, you'll add a chart to the dashboard.
-
Carefully click in the area just below the right Web Part Zone. You will place the next component below the zone, not inside it.
-
In Microsoft FrontPage, select Insert Web Component.
-
In the Insert Web Component dialog, select Spreadsheets and Charts from the Component Type list.
-
In the Choose a Control list, select Office Chart.
-
Click Finish. A new chart space will be added to the page and the Commands and Options dialog will open.
-
On the Data Source tab, click the option to display "Data typed into a data sheet".
-
In the data sheet, type the information contained in Table 4-1.
Table 4-1: Data for the Web Component CATEGORY
SALES
Beverages
102074
Condiments
55277
Confections
80894
Dairy Products
114749
Grains/Cereals
55948
Meat/Poultry
81338
Produce
53019
Seafood
65544
-
On the Type tab, select the column chart.
-
Close the Commands and Options dialog.
-
In the web page, size the chart to fit comfortably in the available space.
-
Select File Save to save your work.
-
Select File Exit to close Microsoft FrontPage.
Accessing the Site from SPS
Once the new site is completed, you can add a reference to it in SPS. Adding a linked reference will make the site available in the Site Directory and through searches. You can also manage many aspects of the site using standard SPS management tools.
-
Log in to SPS as a member of the Administrator site group.
-
On the portal home page, click the Sites link.
-
On the Site Directory, click the Add Link to Site link under the Actions list.
-
On the Add Link to Site page, name the site Executive Dashboard and give it a description.
-
In the URL field, type http://spsportal/ExecutiveDashboard .
-
In the Areas section, click the Change Location link.
-
In the Change Location site map, expand the nodes and check the areas Sites and Topics Departments.
-
Click OK to close the site map.
-
Click OK again to add the new site link.
-
Using the site map, navigate to the area where you placed a link to the new site.
-
On the home page, verify that the web parts are working correctly and then click the Site Settings link.
-
On the Site Settings page, select Administration Go to Site Administration.
-
On the Site Administration page, select Users and Permissions Manage Permission Inheritance.
-
On the Manage Permission Inheritance page select Use Unique Permissions.
-
Click OK to return to the Site Settings page.
-
On the Site Settings page, select Administration Manage Users.
-
Adjust the permissions so that only appropriate management and financial personnel can access the new dashboard.
EAN: N/A
Pages: 92