A Custom Performance Monitoring Tool
|
| < Free Open Study > |
|
We will conclude the chapter by developing a simple yet effective J2EE performance monitoring tool for web applications. The advantage of developing such a tool in-house is that most of the commercially-available performance monitoring tools and stress testers are pretty expensive.
We will use the servlet filter API for this purpose. We will write a filter through which all of the requests are passed. The filter will record the request path and the response time for all the requests. To avoid the filter affecting the performance of the system, we will just dump the performance data into an application scope bean when the request passes through the filter. We will then provide a servlet that will extract this data, and compute and display the following information:
-
Request path
-
Total number of hits
-
Total response time
-
Minimum response time
-
Maximum response time
-
Average response time
Monitor Framework Classes
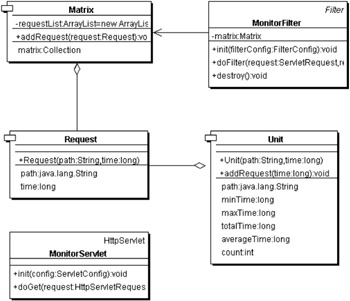
The UML diagram below depicts the relationships between the classes that comprise the monitor framework:
-
The Request class represents the request path and response time each time a request is executed
-
The Matrix class functions as an accumulation of Request objects
-
The Unit class represents data relevant to unique request paths, such as total time it was accessed, average response time, minimum and maximum response time, and so on
-
The MonitorFilter class acts as our filter
-
The MonitorServlet class extracts the performance data and displays it back to the client browser
The Request Class
The source code for the Request class is shown below.
package monitor; public class Request {
First we define the string that represents the request path, and the response time for the request:
private String path; private long time;
Then we define the constructor:
public Request(String path, long time) { this.path = path; this.time = time; }
Finally, the getPath() method fetches the request path, and the getTime() method fetches the response time:
public String getPath() { return path; } public long getTime() { return time; } }
The Unit Class
This class functions as an aggregation of requests that share the same request path. It provides methods for accessing the path, the minimum, maximum, total, and average response time, and the total number of hits.
package monitor; public class Unit {
The following variable holds the request path:
private String path; We define variables to hold the minimum, maximum, and total response time for the requests:
private long minTime; private long maxTime; private long totalTime;
A variable to hold the total number of hits for the request path:
private int count; An instance of this class is instantiated every time a request having the particular request path is accessed for the first time:
public Unit(String path, long time) { this.path = path; minTime = time; maxTime = time; totalTime = time; count = 1; }
Here are the getter methods:
public String getPath() { return path; } public long getMinTime() { return minTime; } public long getMaxTime() { return maxTime; } public long getTotalTime() { return totalTime; } public long getAverageTime() { return totalTime/count; } public int getCount() { return count; }
Every time the filter receives a request corresponding to a particular request path, the minimum response time, maximum response time, total response time and the total number of hits are updated:
public void addRequest(long time) { if(time < this.minTime) this.minTime = time; if(time > this.maxTime) this.maxTime = time; totalTime += time; count++; } }
The Matrix Class
The Matrix class maintains a collection of Request objects, and also provides a method to compute and return a collection of Unit objects from the available collection of Request objects.
package monitor; import java.util.ArrayList; import java.util.Collection; import java.util.HashMap; import java.util.Iterator; public class Matrix {
This class stores a collection of Request objects:
private ArrayList requestList = new ArrayList(); The addRequest() method adds a new request to the collection:
public void addRequest(Request request) { requestList.add(request); }
The getMatrix() method computes and returns a collection of Unit objects from the collection of Request objects.
public Collection getMatrix() { ArrayList clone; HashMap unitMap = new HashMap();
First we clone a list of Request objects from the existing list:
synchronized(this) { clone = (ArrayList)requestList.clone(); }
Then we iterate through the list, and compute the list of Unit objects corresponding to unique request paths:
Iterator it = clone.iterator(); while(it.hasNext()) { Request request = (Request)it.next(); if(!unitMap.containsKey(request.getPath())) { unitMap.put(request.getPath(), new Unit(request.getPath(), request.getTime())); }else { Unit unit = (Unit)unitMap.get(request.getPath()); unit.addRequest(request.getTime()); } } return unitMap.values(); } }
The MonitorFilter Class
This class acts as our filter.
package monitor; import javax.servlet.Filter; import javax.servlet.FilterConfig; import javax.servlet.ServletRequest; import javax.servlet.ServletResponse; import javax.servlet.FilterChain; import javax.servlet.ServletException; import javax.servlet.ServletContext; import javax.servlet.http.HttpServletRequest; import javax.servlet.http.HttpServletResponse; import java.io.IOException; public class MonitorFilter implements Filter { private Matrix matrix;
We create a Matrix object, and store it as an application scope bean in the filter initialization method:
public void init(FilterConfig filterConfig) { matrix = new Matrix(); filterConfig.getServletContext().setAttribute("MATRIX", matrix); } public void doFilter(ServletRequest request, ServletResponse response, FilterChain chain) throws IOException, ServletException {
In the doFilter() method, we start by getting the request start time:
long time = System.currentTimeMillis(); Then we get the request path and process the request, and derive how long this process took:
String path = ((HttpServletRequest)request).getServletPath(); chain.doFilter(request, response); time = System.currentTimeMillis() - time;
Finally we create and add the Request object, once the request is processed, by storing the request path and total elapsed time:
matrix.addRequest(new Request(path, time)); } public void destroy() { matrix = null; } }
The MonitorServlet Class
The MonitorServlet computes and displays the performance data:
package monitor; import javax.servlet.*; import javax.servlet.http.*; import java.io.*; import java.util.Iterator; public class MonitorServlet extends HttpServlet { public void init(ServletConfig config) throws ServletException { super.init(config); } public void doGet(HttpServletRequest request, HttpServletResponse response) throws ServletException, IOException {
In the doGet() method, we retrieve the Matrix object stored as an application scope bean:
Matrix matrix = (Matrix)getServletContext().getAttribute("MATRIX"); Then we get an Iterator for the collection of Unit objects:
Iterator it = matrix.getMatrix().iterator(); Next we display the performance data as an HTML table. You may very well display this data using JSPs and custom tags:
StringBuffer sb = new StringBuffer(); sb.append("<html><head><title></title></head><body><table border=1>"); sb.append("<tr>"); sb.append("<th>Request Path</th>"); sb.append("<th>Number of Hits</th>"); sb.append("<th>Total Response Time</th>"); sb.append("<th>Min Response Time</th>"); sb.append("<th>Max Response Time</th>"); sb.append("<th>Average Response Time</th>"); sb.append("</tr>"); while(it.hasNext()) { Unit unit = (Unit)it.next(); sb.append("<tr>"); sb.append("<th>" + unit.getPath() + "</th>"); sb.append("<th>" + unit.getCount() + "</th>"); sb.append("<th>" + unit.getTotalTime() + "</th>"); sb.append("<th>" + unit.getMinTime() + "</th>"); sb.append("<th>" + unit.getMaxTime() + "</th>"); sb.append("<th>" + unit.getAverageTime() + "</th>"); sb.append("</tr>"); } sb.append("<html><head><title></title></head><body><table>"); PrintWriter writer = response.getWriter(); writer.println(sb.toString()); writer.flush(); writer.close(); } }
Using the Monitor
To use the monitor in your application, you need to compile all the above classes and add them to the /WEB-INF/classes/monitor directory of the web application. You will also have to add the filter and servlet entries to your deployment descriptor as shown below:
... <filter> <filter-name>monitor</filter-name> <filter-class>monitor.MonitorFilter</filter-class> </filter> <filter-mapping> <filter-name>monitor</filter-name> <url-pattern>/*</url-pattern> </filter-mapping> <servlet> <servlet-name>monitor</servlet-name> <servlet-class>monitor.MonitorServlet</servlet-class> </servlet> <servlet-mapping> <servlet-name>monitor</servlet-name> <url-pattern>/monitor</url-pattern> </servlet-mapping> ...
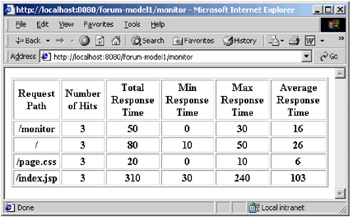
The screenshot below displays the output of the monitor servlet used with a test application.
|
| < Free Open Study > |
|
EAN: 2147483647
Pages: 130
- Chapter III Two Models of Online Patronage: Why Do Consumers Shop on the Internet?
- Chapter VII Objective and Perceived Complexity and Their Impacts on Internet Communication
- Chapter VIII Personalization Systems and Their Deployment as Web Site Interface Design Decisions
- Chapter XI User Satisfaction with Web Portals: An Empirical Study
- Chapter XVII Internet Markets and E-Loyalty