Using the Office Tools
When you install Office, you have the option of installing one or more of a group of Office Tools programs. These programs are designed to generate various types of information that you can embed in your Office documents. The Office Tools programs can't be run independently, nor can they create their own documents. You can run them only from an application, and the data they generate can be stored only as embedded objects. To run an Office Tools program, perform the following general steps:
- Place the insertion point at the position in the receiving Office document where you want to insert the embedded object.
- Choose Object from the receiving program's Insert menu, and click the Create New tab (or option button) in the Object (or Insert Object) dialog box.
- Select the appropriate object description in the Object Type list, and click OK. Table 35-1 lists each of the standard object descriptions for the Office Tools programs.
- Use the commands of the Office Tools source program to enter the data for the embedded object into the working area provided. The working area will be either within the receiving program window or within a separate window displayed by the source program. (With the Clip Gallery program, you choose a picture in a list rather than entering your own data.)
- Exit the editing mode. If you're working in the receiving program's window, exit editing mode by clicking in the program window outside the embedded object. If you're working in the source program's window, exit editing mode by choosing Exit from the source program's File menu or by closing the source program window; to save your work, answer Yes when asked whether you want to update the object.
Table 35-1. The Office Tools Programs
| Office Tools Program | Object Description Displayed in the Object Dialog Box | Purpose of Program |
|---|---|---|
| Clip Gallery | Microsoft Clip Gallery | Locates and inserts picture, sound, or motion (video) clips into your documents |
| Equation Editor | Microsoft Equation 3.0 | Enters mathematical expressions into your documents |
| Microsoft Graph | Microsoft Graph 2000 Chart | Creates charts for displaying data |
| Organization Chart | MS Organization Chart 2.0 | Creates organization charts and other types of hierarchical charts |
TIP
Try Another Way to Run Office Tools ProgramsSome of the Office applications let you quickly run one or more of the Office Tools programs by choosing a command from the Picture submenu of the Insert menu. For example, in Excel you can run the Clip Gallery by choosing Clip Art from this submenu, or you can run the Organization Chart program by choosing Organization Chart. Likewise, in Word you can run the Clip Gallery by choosing Clip Art, or you can run Microsoft Graph by choosing Chart.
To edit an object embedded by an Office Tools program, use any of the methods discussed previously in the chapter under "Embedding Data" Note that when you "edit" a Clip Gallery object, you replace the current clip with another one, rather than actually editing the graphic, sound, or video data.
The following sections introduce you to each of the Office Tools programs. Keep in mind that each program provides extensive online Help from which you can learn the details of using the program's commands.
![]()
Using the Clip Gallery
The Clip Gallery program can help you to find and organize picture, sound, and motion clips, and to insert them into your Office documents. When you select the Microsoft Clip Gallery item in the Object dialog box and click OK, the Clip Gallery program is displayed in a separate window. Here are the basic steps for using the program:
- Click the tab for the type of clip you want to insert: the Pictures tab for inserting a graphic image, the Sounds tab for inserting an audio clip, or the Motion Clips tab for inserting a video sequence. The tab will initially display the different categories of clips. See Figure 35-13.
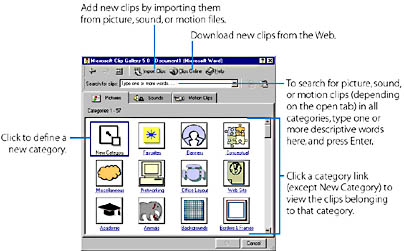
Figure 35-13. The Pictures tab of the Clip Gallery window, displaying the categories of clips.
- Click the category you want. The tab will now display all the clips belonging to that category.
- Click the clip you want, and then click one of the buttons on the pop-up toolbar to perform the desired action. See Figure 35-14.
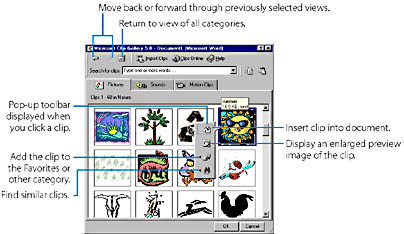
Figure 35-14. Selecting a clip in the Nature category.
NOTE
The Clip Gallery program comes with a variety of picture, sound, and motion clips. You can add additional clips to the program by importing them from picture, sound, or motion files, or by downloading them from Microsoft's Clip Gallery page on the Web.
Using the Equation Editor
The Equation Editor lets you add mathematical expressions to your documents. When you select the Microsoft Equation 3.0 item in the Object dialog box and click OK, a working area is inserted into the receiving document, and the Equation Editor toolbar and menus are displayed within the receiving program's window. See Figure 35-15.
To create a mathematical expression, do the following:
- To enter numbers or variables, simply type them using the keyboard, such as the y typed to begin the following example equation:

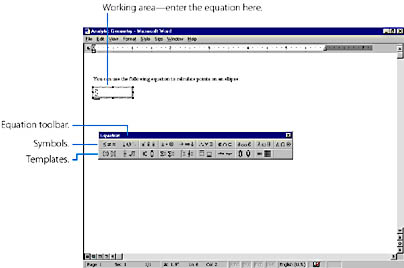
Figure 35-15. Embedding an Equation Editor object in a Word document.
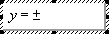
- To enter a mathematical operator that appears on the keyboard, such as the plus sign (+), the minus sign (-), or the equal sign (=), you can simply type it. For instance, you could add an equal sign to the example equation:

- To enter an operator or symbol that doesn't appear on the keyboard, click the appropriate button on the top row of the Equation toolbar, and then click the desired symbol on the drop-down palette of symbols. For example, you would click the following:
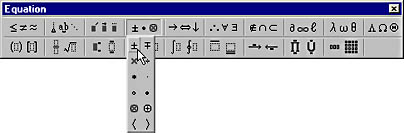
to add a plus or minus symbol (±) to the example equation:
- To enter an expression such as a fraction, a square root, an exponent, or an integral, click the appropriate button on the bottom row of the Equation toolbar, and then choose one of the templates on the drop-down palette. For example, you would click the following template:
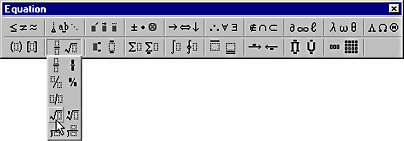
to add a square-root expression to the example equation:

Then enter the desired numbers and variables into the area marked by dotted lines within the template. For example, you could type the following into the radical expression in the example equation:
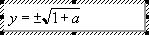
You can insert templates within other templates to create nested operator expressions, such as a fraction within a square-root operator.
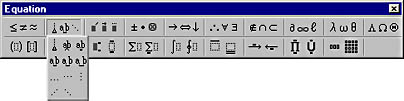
The Equation Editor won't let you enter space characters when you're typing an expression because it automatically sets the spacing between the numbers and symbols that you enter (for consistency). You can adjust the spacing or alignment of symbols, however, by selecting symbols from the Spaces And Ellipses palette, as shown below, or by choosing commands from the Format menu.
You can also modify the font, font size, or format (that is, normal, bold, or italic) of characters or symbols by choosing commands from the Style and Size menus.
Using Graph
Using the Graph program, you can insert charts into your Office documents. Graph supports a wide variety of chart types and provides a handy alternative to using Excel charts. The easiest way to create a chart using the Graph program is to use a Word table, as follows:
- Insert a table into a Word document, enter into this table the data that you want to graph, and then select the entire table. An example is shown in Figure 35-16.
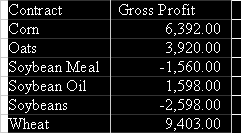
Figure 35-16. Selecting a Word table containing the data that you want to graph.
- Choose Object from the Insert menu, click the Create New tab, select the Microsoft Graph 2000 Chart object type, and click OK. Alternatively, you can point to Picture on the Insert menu and choose Chart from the submenu.
Graph will immediately embed a chart into the document that depicts the data contained in the Word table. Graph will also display a datasheet containing the chart data. See Figure 35-17.
ON THE WEB
The GraphTab.doc example file is on the Running Office 2000 Reader's Corner page.
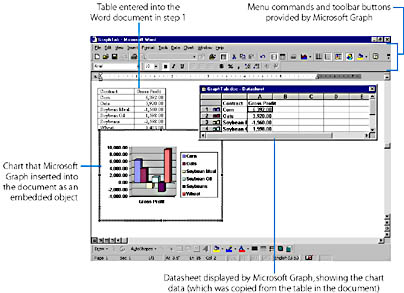
Figure 35-17. Embedding a Chart object in a Word document. This chart is based on the Word table shown in Figure 35-16.
If you later want to modify the chart, simply double-click the embedded chart object. The Graph commands will return, and you can change the features of the chart. If the datasheet isn't visible (and you need to change the numbers shown on the chart), you can display it by choosing Datasheet from the View menu or by clicking the View Datasheet button on the Graph toolbar. If you want to display the chart within another Office document (for example, in a PowerPoint presentation), select the Chart object, cut or copy it, and then paste it into the other document.

Note that if you embed a new Graph object within a program other than Word (by choosing the Object command from the program's Insert menu), or if you embed a new Graph object in a Word document without first selecting a table containing valid chart data, Graph will create an example chart displaying example data. You'll then need to enter the actual data, as well as the row and column headings, into the Graph datasheet.
SEE ALSO
For information on Word tables, see "Using Tables." For details on creating charts in Excel, see Chapter 21, "Creating Worksheet Charts."
Using Organization Chart
You can use the Microsoft Organization Chart program to add organization charts and other types of hierarchical charts to your Office documents. When you select the MS Organization Chart 2.0 object type in the Object dialog box and click OK, the Organization Chart program opens a separate window, which displays a template for a new chart, as shown in Figure 35-18.
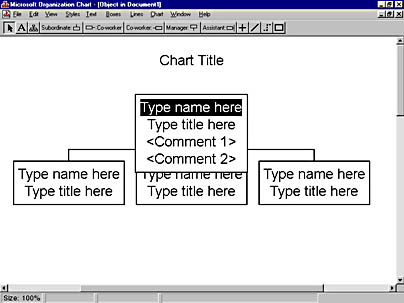
Figure 35-18. The Organization Chart program window when you first start the program.
The following are the basic procedures for creating an organization chart:
- To select a box, click the Select toolbar button if it's not already pressed in, and then click the box.
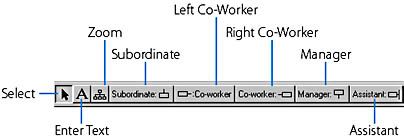
- To add a new box to the chart, click the button for the type of relationship you want to depict: Subordinate, Left Co-Worker, Right Co-Worker, Manager, or Assistant. Then click the existing box to which you want to attach the new box.
- To delete a box, select it and press the Delete key.
- To move a box, click the Select button, and then drag the box onto another box. (Make sure the box isn't selected and doesn't contain the insertion point; otherwise, you won't be able to drag it.) The position where you drop the box determines its relationship to the other box.
- To add or modify text in a box or in the chart title, click the Enter Text button on the toolbar, and then click the text at the position where you want to add or edit characters.
- To modify the format of the chart, first select the part that you want to modify, and then apply a formatting command. To select a box or line, click the Select button, and then click the box or line; to select additional boxes or lines, press Shift while you click each one. To select text, click the Enter Text button, and then highlight the text by dragging over it. Alternatively, you can select various groups of boxes or lines using the Select submenu or the Select Levels command on the Edit menu.
You can then change the chart type using the Styles menu, the formatting and alignment of text using the Text menu, the appearance of boxes using the Boxes menu, the appearance of lines using the Lines menu, or the chart background color using the Chart menu.
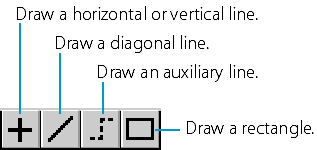
- You can draw lines and rectangles on the chart using the drawing buttons. To display these buttons, choose Show Draw Tools from the View menu.
When you have finished creating the chart, choose Exit And Return To Document (where Document is the name of your Office document) from the File menu, and answer Yes when asked if you want to update the object in the document. The organization chart will be inserted into your Office document.