25.2 Using GlancePlus
| |
GlancePlus is an additional package that is used for system monitoring. It can be used either in text or graphic mode. GlancePlus shows statistics about a number of system components. Some of these components are system memory, virtual memory, CPU, processes, and disk and I/O utilization. You can start GlancePlus using the glance command in text mode. You will see a screen similar to that shown in Figure 25-2 when you start glance .
Figure 25-2. GlancePlus in text mode.
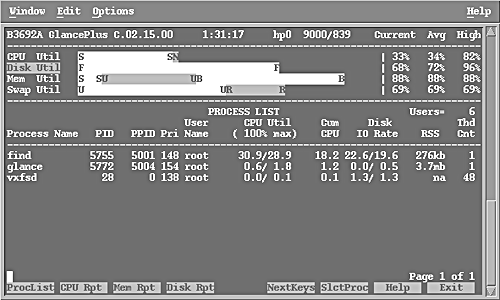
In this figure, the first line shows information about GlancePlus itself and the system on which it is running. The next lines show information about CPU, disk, memory, and swap utilization.
CPU Utilization
The line that shows CPU utilization starts with a bar of different shades. It is divided into parts that show CPU utilization for different purposes. Each part of the bar starts and ends with a character that shows one of four types of information.
-
The S part indicates the percentage of CPU time utilized for system activities.
-
The N part shows the percentage of CPU time utilized for niced processes. These are the processes that are running at a lower priority level.
-
The U part shows the percentage of time spent in running user processes.
-
The R part shows the percentage of time utilized for real time processes.
The rightmost part of the line shows the current, average, and highest percentage of CPU utilization since the start of GlancePlus.
Disk Utilization
The disk utilization bar has two parts. Like the CPU utilization bar, these parts show the percentage of disk utilization for different activities.
-
The F part shows file system activity. This is the utilization of disk I/O for file read or write operations.
-
The V part shows virtual memory activity. If this part is constantly large, it shows insufficient physical memory in your system.
In the rightmost part of the line, the current, average, and highest percentage of disk utilization is displayed.
Memory Utilization
Below the disk utilization bar is the memory utilization bar. It is divided into three parts.
-
The S part shows memory used by system processes.
-
The U part shows memory used by user programs.
-
The B part indicates memory used by buffer cache.
The rightmost part of the line shows the current, average, and highest utilization, which has the same meaning as in the case of CPU and disk utilization.
Swap Utilization
The next line contains a bar for swap space utilization.
-
The U part shows the swap space in use.
-
The R part indicates the reserved part of swap space. An area in the swap is reserved as soon as a process is created. A reserved area may not be in use.
Processor List
The bottom part of the screen is the process list. This list is similar to that created by the ps and top commands. By default, all processes are not listed here. Only those processes that are using system resources are present in the list. Columns in this part are:
| Process Name | Name of the command that created the process. |
| PID | Process ID. |
| PPID | Process ID of the parent process. |
| PRI | Priority of the process. This is a number between 0 and 255. The higher the number, the lower the priority. |
| User Name | Name of the user who started the process. |
| CPU Util | The first number is the percentage of CPU used during the last interval. The second number is the percentage of CPU utilization since the start of GlancePlus. By default, GlancePlus updates this list every five seconds. |
| Cum CPU | Cumulative CPU usage by a process. |
| Disk IO Rate | The first number is the average disk I/O rate during the last interval. The second number is the average disk I/O rate since GlancePlus started. |
| RSS | Amount of RAM used by a process. |
| Thd Cnt | Thread Count. |
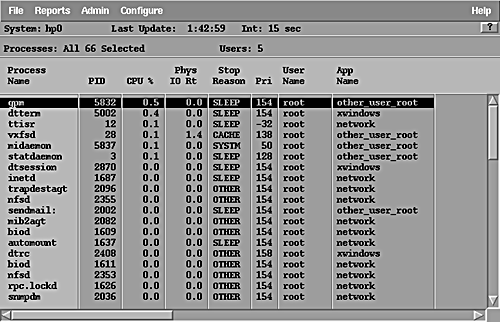
If you start GlancePlus in GUI mode by using the gpm command, a window is displayed as shown in Figure 25-3. The process list window can be opened using the Reports menu and is shown in Figure 25-4.
Figure 25-3. GlancePlus in GUI.
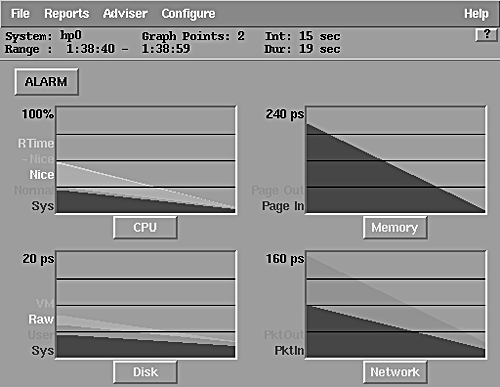
Figure 25-4. GlancePlus process list.
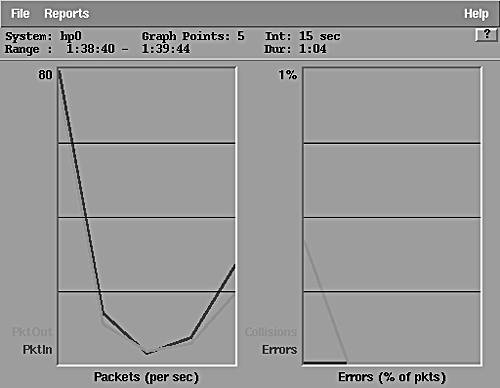
The topmost line in Figure 25-3 shows the system name, how many times the graph has been updated ( Graph Points ), and the elapsed time following the update. The second line shows the start time and the time of the last update. The duration of the current session is 19 seconds, as shown in the last part of the second line. The question mark button can be pressed at any time to get help. The major part of the window contains four graphs, showing CPU, memory, disk, and network statistics. Clicking on the button displayed under the respective graph may further expand any of these parts. For example, if you want to get more information about network activity, clicking the network button will show you a window like the one displayed in Figure 25-5.
Figure 25-5. Network activity.
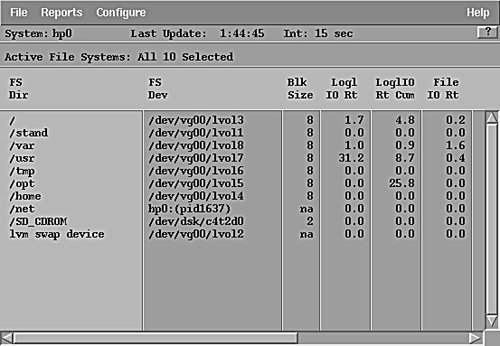
There are many reports that can be generated using the Reports menu in the GlancePlus window. Figure 25-6 shows I/O activity taking place on logical volumes . A detailed discussion of GlancePlus is beyond the scope of this book.
Figure 25-6. I/O by logical volumes.
| |
| |
| Top |
EAN: 2147483647
Pages: 390