Section 2.4. Process Structures
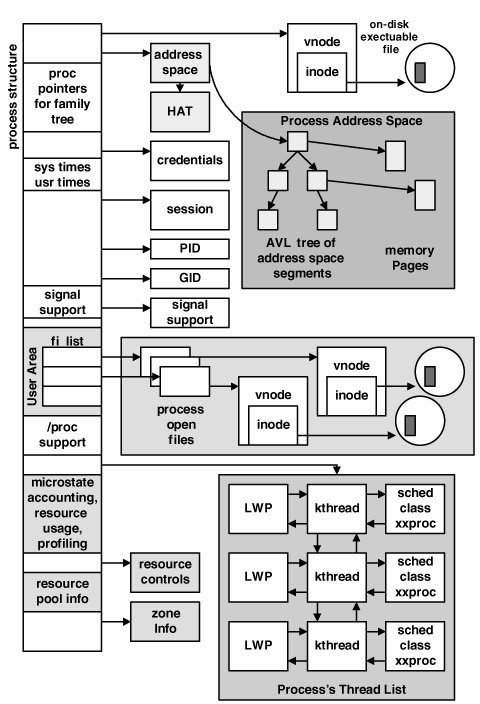
2.4. Process StructuresThe objects that make up a process are defined as data structures and managed as such in the kernel. This includes not only kernel threads and LWPs but also many of the support objects linked to a process through pointers in the process structure. In this section, we examine the kernel data structures that define the major components of a process. For the record, not every member of every data structure is covered. The objective is to discuss the major components of the threaded process model in order to effectively cover key concepts. A great many subtleties are beyond the scope of our coverage in this text. 2.4.1. The proc StructureThe process structure, or proc structure, provides the framework for the creation and management of processes and threads in the Solaris environment. Like any kernel data structure, the members of the proc structure cover the full range of data types, including a great many pointers to support structures that, in total, make up the entire process picture in the Solaris environment. Figure 2.3 provides the big picture. Figure 2.3. Process Structure The structure definition for a process can be found in usr/src/uts/common/ sys/proc.h. As we take a closer look at the key fields, we will view segments of the process structure from the source along the way. typedef struct proc { /* * Fields requiring no explicit locking */ struct vnode *p_exec; /* pointer to a.out vnode */ struct as *p_as; /* process address space pointer */ struct plock *p_lockp; /* ptr to proc struct's mutex lock */ kmutex_t p_crlock; /* lock for p_cred */ struct cred *p_cred; /* process credentials */ . . . See usr/src/uts/common/sys/proc.h
sol10$ pmap -x 20636 20636: ./ml Address Kbytes RSS Anon Locked Mode Mapped File 00010000 8 8 - - r-x-- ml 00020000 8 8 8 - rwx-- ml 00022000 1528 1528 1528 - rwx-- [ heap ] FF280000 848 784 - - r-x-- libc.so.1 FF364000 32 32 32 - rwx-- libc.so.1 FF36C000 8 8 8 - rwx-- libc.so.1 FF3A0000 24 16 16 - rwx-- [ anon ] FF3B0000 176 176 - - r-x-- ld.so.1 FF3EC000 8 8 8 - rwx-- ld.so.1 FF3EE000 8 8 8 - rwx-- ld.so.1 FFBFE000 8 8 8 - rwx-- [ stack ] -------- ------- ------- ------- ------- total Kb 2656 2584 1616 - Above is sample output of the pmap(1) command (with the -x flag), which dumps all the segments that make up a process's virtual address space. The pmap(1) display provides the virtual address of the mapping (Address), the virtual address space size of the mapping (Kbytes), how much of the mapping is resident in physical memory (RSS), the number of memory pages of anonymous memory in the segment (Anon), number of pages locked (Locked), the segment permissions, and mapped file. Anon memory is reported for heap and stack segments, as well as copy-on-write (COW) pages (see Figure 9.2). Note the permissions of the stack segment in the example. There is a security exposure to mapping stack pages with exec permissions. Buffer overflow attacks exploit executable stack segments by inserting rogue code on a process's stack, setting the program counter, and executing instructions. You can set an /etc/system variable, called noexec_user_stack, to prevent the mapping of stack pages with execute permissions. Note that this is necessary only for 32-bit executables because the SPARC V8 ABI specifies read/write/exec permissions for stack mappings. The ABI for 64-bit SPARC V9 binaries defines the stack as not executable (no exec). Here's the same test program recompiled as a 64-bit SPARC V9 binary. sol10$ pmap -x 23727 23727: ./ml Address Kbytes RSS Anon Locked Mode Mapped File 0000000100000000 8 8 - - r-x-- ml 0000000100100000 8 8 8 - rwx-- ml 0000000100102000 1136 1136 1136 - rwx-- [ heap ] FFFFFFFF7F200000 896 616 - - r-x-- libc.so.1 FFFFFFFF7F3E0000 64 64 64 - rwx-- libc.so.1 FFFFFFFF7F400000 24 16 16 - rwx-- [ anon ] FFFFFFFF7F500000 8 8 8 - rwx-- [ anon ] FFFFFFFF7F600000 176 176 - - r-x-- ld.so.1 FFFFFFFF7F72C000 16 16 16 - rwx-- ld.so.1 FFFFFFFF7FFFE000 8 8 8 - rw--- [ stack ] ---------------- ---------- ---------- ---------- ---------- total Kb 2344 2056 1256 - Note that the exec permission mode is not set on the stack segment. Also, we can easily tell this is a 64-bit binary by the Address columnthe addresses are 64 bits wide. Additional options to pmap(1) provide the memory page size for each segment and swap reservations.
A user's UID and GID are established through fields in the /etc/passwd file when the user's account is set up. You can use the id(1M) command to see what your UID and GID are. Use the su(1) command to change user identities. Use the newgrp(1) command to change your real and effective GID. The UID and GID of the user that started the process have their credentials maintained here in the credentials structure, and effective UID and GID are maintained here as well. Solaris supports the notion of effective UID and GID, which allow for the implementation of the setuid and setgid mode bits defined in a file's inode (remember, the process started life as an executable file on a file system). A process could have an effective UID that is different from the UID of the user that started the process. A common example is a program that requires root (UID 0) privileges to do something, for example, the passwd(1) command, which writes to protected files (/etc/passwd and /etc/shadow). Such a program is owned by root (aka superuser), and with the setuid bit set on the file, the effective UID of the process is 0. During process execution, the kernel checks for effective UID and GID during permission checks, which will be the same as the UID and GID of the user if neither the setuid nor setgid mode bit has been set. struct cred { uint_t cr_ref; /* reference count */ uid_t cr_uid; /* effective user id */ gid_t cr_gid; /* effective group id */ uid_t cr_ruid; /* real user id */ gid_t cr_rgid; /* real group id */ uid_t cr_suid; /* "saved" user id (from exec) */ gid_t cr_sgid; /* "saved" group id (from exec) */ uint_t cr_ngroups; /* number of groups returned by */ /* crgroups() */ cred_priv_t cr_priv; /* privileges */ projid_t cr_projid; /* project */ struct zone *cr_zone; /* pointer to per-zone structure */ gid_t cr_groups[1]; /* cr_groups size not fixed */ /* audit info is defined dynamically */ /* and valid only when audit enabled */ /* auditinfo_addr_t cr_auinfo; audit info */ }; See usr/src/uts/common/sys/cred_impl.h New features in Solaris 10 required some new fields in the credentials structure. Process privileges (see Chapter 5) allow processes to acquire specific privileges to perform operations that previously required root permissions. struct priv_set { priv_chunk_t pbits[PRIV_SETSIZE]; }; typedef struct cred_priv_s { priv_set_t crprivs[PRIV_NSET]; /* Priv sets */ uint_t crpriv_flags; /* Privilege flags */ } cred_priv_t; See usr/src/uts/common/sys/priv_impl.h For every process, there are four sets of privileges: the effective set, the inheritable set, the permitted set and the limit set. See the privileges(5) man page for a complete list of process privileges, and the ppriv(1) man page for information on setting process privileges. Moving on to the next set of fields in proc.h, we arrive at the following: . . . int p_swapcnt; /* number of swapped out lwps */ char p_stat; /* status of process */ char p_wcode; /* current wait code */ ushort_t p_pidflag; /* flags protected only by pidlock */ int p_wdata; /* current wait return value */ pid_t p_ppid; /* process id of parent */ . . . See usr/src/uts/common/sys/proc.h
/* stat codes */ #define SSLEEP 1 /* awaiting an event */ #define SRUN 2 /* running */ #define SZOMB 3 /* process terminated but not waited for */ #define SSTOP 4 /* process stopped by debugger */ #define SIDL 5 /* intermediate state in process creation */ #define SONPROC 6 /* process is being run on a processor */ See usr/src/uts/common/sys/proc.h A few areas in the kernel operate on processes (as opposed to threads) where process state is set when a process is checked. In the fork() code, during process creation, the SIDL state is set, and later in fork, p_stat is set to SRUNthe process has been created and is runnable. In the exit() code, pstat is set to ZOMB when a process is terminated. The support code for process groups, process-to-CPU binding, and resource controls also checks process state at various points. Those areas aside, all other state changes during the lifetime of a process occur in the kthread and are reflected in the state field in the kthread structure. In fact, the state (S) column from the ps(1) command is derived from the kthread state field, not the process p_stat data. If a process has more than one LWP and the -L flag has not been specified on the ps(1) command line, then the state field is derived from a representative LWP, selected by the prchoose() kernel function when ps(1) is executed (the -L flag to ps(1) prints information about each LWP in each selected process).
The process model in the Solaris kernel maintains a lineage for all the processes running on the system. That is, every process has a parent process and may have child processes. The process creation model, in which a new process begins life as the result of an existing process issuing some variant of the fork(2) system call, means that, by definition, there will minimally be a parent process to the newly created process. Not only will a process have a parent, but it may also have siblingsprocesses that have been created by the same parent. Every process in the Solaris environment can reside on as many as a dozen or so linked lists maintained by the kernel; the proc structure stores the various pointers required. struct proc *p_link; /* forward link */ struct proc *p_parent; /* ptr to parent process */ struct proc *p_child; /* ptr to first child process */ struct proc *p_sibling; /* ptr to next sibling proc on chain */ struct proc *p_psibling; /* ptr to prev sibling proc on chain */ struct proc *p_sibling_ns; /* prt to siblings with new state */ struct proc *p_child_ns; /* prt to children with new state */ struct proc *p_next; /* active chain link next */ struct proc *p_prev; /* active chain link prev */ struct proc *p_nextofkin; /* gets accounting info at exit */ struct proc *p_orphan; struct proc *p_nextorph; See usr/src/uts/common/sys/proc.h We do not elaborate further on the process lineage pointersthey are generally self-explanatory. The next set of pointers support process groups, session management, and PID information maintenance. . . . struct proc *p_pglink; /* process group hash chain link next */ struct proc *p_ppglink; /* process group hash chain link prev */ struct sess *p_sessp; /* session information */ struct pid *p_pidp; /* process ID info */ struct pid *p_pgidp; /* process group ID info */ . . . See usr/src/uts/common/sys/proc.h
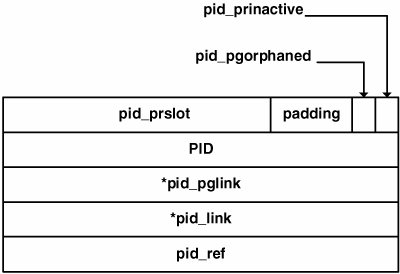
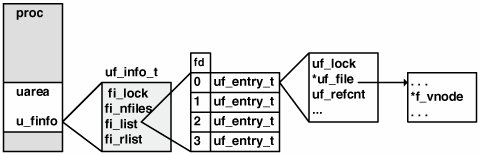
The PID structure stores 2 status bits, pid_prinactive and pid_pgorphaned, to flag the PID structure as being free (prinactive) and to mark the process as orphaned or not (pgorphanedno parent process), followed by 6 pad bits (unused bits) and 24 bits to store the slot number of the /proc table entry for the process, pid_prslot. The PID is the actual process ID. The PID structure links to other PID structures in the kernel through pid_link, which maintains a hashed list of active PIDs in the kernel, and pid_pglink, which links back to the process structure. Several condition variables are maintained in the proc structure. Condition variables in the Solaris environment implement sleep and wakeup. One such condition variable is p_holdlwps, a special condition variable for holding process LWPs. In a fork(), the LWPs must be suspended at some point so that their kernel stacks can be cloned for the new process. p_lwpexit is a condition variable used when a process's LWP is exiting so that the required process-level cleanup can be done and utilization fields updated. The kernel maintains time totals that reflect the amount of user time and system time the process accumulated, as well as summations for all the child processes' system time and user time. The child information is summed when a child process exits. The p_utime and p_stime fields maintain the process's user and system time, respectively; the p_cutime and p_cstime fields maintain the child process's user and system time. /* * Per-process lwp and kernel thread stuff */ id_t p_lwpid; /* most recently allocated lwpid */ int p_lwpcnt; /* number of lwps in this process */ int p_lwprcnt; /* number of not stopped lwps */ int p_lwpdaemon; /* number of TP_DAEMON lwps */ int p_lwpwait; /* number of lwps in lwp_wait() */ int p_lwpdwait; /* number of daemons in lwp_wait() */ int p_zombcnt; /* number of zombie lwps */ kthread_t *p_tlist; /* circular list of threads */ lwpdir_t *p_lwpdir; /* thread (lwp) directory */ lwpdir_t *p_lwpfree; /* p_lwpdir free list */ lwpdir_t **p_tidhash; /* tid (lwpid) lookup hash table */ uint_t p_lwpdir_sz; /* number of p_lwpdir[] entries */ uint_t p_tidhash_sz; /* number of p_tidhash[] entries */ uint64_t p_lgrpset; /* unprotected hint of set of lgrps */ /* on which process has threads */ . . . See usr/src/uts/common/sys/proc.h The process maintains several bits of information on LWPs and kernel threads, including a total of all LWPs linked to the process (p_lwpcnt) and all LWPs created (p_lwptotal). Counters are maintained for the number of blocked LWPs (p_lwpblocked), runnable LWPs (p_lwprcnt), and zombie LWPs (p_zombcnt). A pointer rooted in the proc structure references a linked list of kernel threads (p_tlist) and a linked list of zombie threads (p_zomblist). A zombie process is a process that has exited but whose parent process did not issue a wait call to retrieve the exit status. Zombie processes appear as defunct in ps(1) output. The remaining members of the process structure can be grouped into several categories. Per-process signal handling support involves linking to signal queue structures, supporting the signal mask and signal posting structures. The Solaris signal model has undergone significant work to support the multithreaded architecture and is discussed beginning on page 135. Support for the /proc file system requires the inclusion of various pointers and data types in the proc structure. Also, the Solaris kernel includes a facility called Doors, which provides a fast cross-process call interface for procedure calling. Process-level resource usage and microstate accounting information are maintained within the process structure, as well as for each LWP. We discuss the details in Section 2.10.3. Process profiling is supported by the inclusion of a prof structure (p_prof) and is enabled when the program is compiled (that is, before it becomes a "process"). During the execution of the process, process profiling gathers statistical data that tells the programmer which routines the process was spending time executing in and how much time was spent in each function relative to the total execution time of the process. You can use the mdb(1) utility to examine the contents of a proc structure on a running system. # ps PID TTY TIME CMD 29487 pts/1 0:00 sh 5995 pts/1 0:00 ps # mdb -k Loading modules: [ unix krtld genunix specfs dtrace ufs sd ip sctp usba fctl nca nfs random sppp lofs crypto ptm ipc logindmux ] > ::ps ! grep 29487 R 29487 9895 29487 9895 0 0x42004000 0000030009caf7d0 sh R 6033 29487 29487 9895 0 0x42004000 0000030008c1aff0 mdb R 6131 6033 29487 9895 0 0x42004000 0000030009cd6740 grep > 0000030009caf7d0::print proc_t { p_exec = 0x30001ca7dc0 p_as = 0x30008555610 p_lockp = 0x300016c3c80 p_crlock = { _opaque = [ 0 ] } p_cred = 0x30c54cf6df8 . . . > 0x30c54cf6df8::print cred_t { cr_ref = 0xc1 cr_uid = 0 cr_gid = 0 cr_ruid = 0 cr_rgid = 0 cr_suid = 0 cr_sgid = 0 cr_ngroups = 0xb cr_priv = { crprivs = [ { pbits = [ 0x800e2, 0 ] } { pbits = [ 0x800e2, 0 ] } { pbits = [ 0x800e2, 0 ] } { pbits = [ 0xffffffff, 0xffffffff ] } ] crpriv_flags = 0 } cr_projid = 0x1 cr_zone = zone0 cr_groups = [ 0 ] } In the above example, we used ps(1), determined the PID of our shell process, invoked mdb(1), used the ps dcmd to find the process of interest, grabbed the address of the proc structure, and displayed it. To further illustrate our ability to examine process information, we extracted and also printed the address of the credentials structure (the pbits fields represent the process privileges for each of the four privilege sets described earlier). 2.4.2. User AreaThe role of the user area (traditionally referred to as the uarea), has changed somewhat in the Solaris environment when compared with traditional implementations of UNIX. The uarea was linked to the proc structure through a pointer and thus was a separate data structure. The uarea was swappable if the process was not executing and memory space was tight. Today, the uarea is embedded in the process structure. The process kernel stack, which was traditionally maintained in the uarea, is now implemented in the LWP (see Section 2.4.3). typedef struct user { /* * These fields are initialized at process creation time and never * modified. They can be accessed without acquiring locks. */ struct execsw *u_execsw; /* pointer to exec switch entry */ auxv_t u_auxv[__KERN_NAUXV_IMPL]; /* aux vector from exec */ timestruc_t u_start; /* hrestime at process start */ clock_t u_ticks; /* lbolt at process start */ char u_comm[MAXCOMLEN + 1]; /* executable file name from exec */ char u_psargs[PSARGSZ]; /* arguments from exec */ int u_argc; /* value of argc passed to main() */ uintptr_t u_argv; /* value of argv passed to main() */ uintptr_t u_envp; /* value of envp passed to main() */ . . . See usr/src/uts/common/sys/user.h The uarea fields shown above are self-explanatory and align with the standard application binary interface (ABI) in terms of maintaining objects set in the process image when loaded. These variables store the command, argument list from the command line, and the user's environmental variablesshell variables, such as PATH, TERM, HOME, etc. The uarea is where process open file information is maintained, referenced through the uarea's u_finfo variable. This variable is a data structure, uf_info_t, which establishes the base for a list of open files in the process. /* * Per-process file information. */ typedef struct uf_info { kmutex_t fi_lock; /* see below */ kmutex_t fi_pad; /* unused -- remove in next release */ int fi_nfiles; /* number of entries in fi_list[] */ uf_entry_t *volatile fi_list; /* current file list */ uf_rlist_t *fi_rlist; /* retired file lists */ } uf_info_t; See usr/src/uts/common/sys/user.h The list of open files begins with fi_list, which is an array of file entry structures of the type uf_entry_t, and is indexed by the file descriptora numeric value returned from a successful open(2) system call. typedef struct uf_entry { kmutex_t uf_lock; /* per-fd lock [never copied] */ struct file *uf_file; /* file pointer [grow, fork] */ struct fpollinfo *uf_fpollinfo; /* poll state [grow] */ int uf_refcnt; /* LWPs accessing this file [grow] */ int uf_alloc; /* right subtree allocs [grow, fork] */ short uf_flag; /* fcntl F_GETFD flags [grow, fork] */ short uf_busy; /* file is allocated [grow, fork] */ kcondvar_t uf_wanted_cv; /* waiting for setf() [never copied] */ kcondvar_t uf_closing_cv; /* waiting for close() [never copied] */ struct portfd *uf_portfd; /* associated with port [grow] */ /* Avoid false sharing - pad to coherency granularity (64 bytes) */ char uf_pad[64 - sizeof (kmutex_t) - 2 * sizeof (void*) - 2 * sizeof (int) - 2 * sizeof (short) - 2 * sizeof (kcondvar_t) - sizeof (struct portfd *)]; } uf_entry_t; See usr/src/uts/common/sys/user.h The uf_file entry points to the file structure associated with the file. typedef struct file { kmutex_t f_tlock; /* short term lock */ ushort_t f_flag; ushort_t f_pad; /* Explicit pad to 4-byte boundary */ struct vnode *f_vnode; /* pointer to vnode structure */ offset_t f_offset; /* read/write character pointer */ struct cred *f_cred; /* credentials of user who opened it */ struct f_audit_data *f_audit_data; /* file audit data */ int f_count; /* reference count */ } file_t; See usr/src/uts/common/sys/file.h Within the file structure, we find a link to the vnode (f_vnode), which contains the file-system-specific object that defines the file. For example, for a file in UFS, the file's inode is found through the vnode and contains the information necessary to locate the body of the file (see Section 14.2 and Section 15.3 for further information). The links to a process's open file list are shown in Figure 2.5. Figure 2.5. Process Open File List The fi_nfiles value maintains the size of the fi_list array, which does not equate to the actual number of files the process has open. Rather, an initial number of file entries are created for a new process (7). As the process opens files, if the file list is full, a new set of uf_entry_t structures is allocated with ((fi_nfiles x 2) +1) to determine how large to grow the file list. The actual number of files a process can have open is determined by a resource control, max-file-descriptor (see Section 2.6). The fi_rlist is the retired file list. When the file list needs to grow, the new file list will be all the existing file entries, plus the new ones, appended to the end of the list. The old list becomes the process's retired file list. The old list is kept instead of being freed immediately, in case a reference (pointer) still exists to a structure in the old list. The kernel deals with such situations asynchronouslythe cleanup of the old list can happen later and need not add time to the file open path. To obtain a list of a process's open files, use the pfiles(1) command. # pfiles 20208 20208: cp /net/explo.east/proactive/rawdata/e5/82a81be5/explorer.82a81be5.abh Current rlimit: 256 file descriptors 0: S_IFSOCK mode:0666 dev:276,0 ino:24852 uid:0 gid:0 size:0 O_RDWR SOCK_STREAM SO_REUSEADDR,SO_KEEPALIVE,SO_LINGER(60),SO_SNDBUF(49152),SO_R sockname: AF_INET 129.154.54.9 port: 514 peername: AF_INET 192.9.95.30 port: 829 1: S_IFSOCK mode:0666 dev:276,0 ino:24852 uid:0 gid:0 size:0 O_RDWR SOCK_STREAM SO_REUSEADDR,SO_KEEPALIVE,SO_LINGER(60),SO_SNDBUF(49152),SO_R sockname: AF_INET 129.154.54.9 port: 514 peername: AF_INET 192.9.95.30 port: 829 2: S_IFIFO mode:0000 dev:277,0 ino:13720970 uid:0 gid:0 size:0 O_RDWR 3: S_IFREG mode:0644 dev:283,21917 ino:1439108 uid:1 gid:1 size:11755594 O_RDONLY|O_LARGEFILE /net/explo.East/hanfs4/e5/82a81be5/ explorer.82a81be5.abh12bhi-2006.02.05.06.00-tar.gz 4: S_IFREG mode:0600 dev:274,2 ino:757553547 uid:12115 gid:10 size:8388608 O_WRONLY|O_CREAT|O_TRUNC|O_LARGEFILE /tmp/explorer.82a81be5.abh12bhi-2006.02.05.06.00-tar.gz Note some new features in the output of pfiles(1). The target process in this case is cp(1), copying files over a network, so the first two file descriptors are TCP sockets. In addition to the original pfiles(1) data (file type, permissions, device, inode number, user and group ID), we see the local and remote address and port number for the socket connection and various socket attributes (SO_KEEPALIVE, etc). Like the process structure, the uarea contains supporting data for signals, including an array that defines the disposition for each possible signal. The signal disposition tells the operating system what to do in the event of a signal: ignore it, catch it and invoke a user-defined signal handler, or take the default action. See Section 2.11. 2.4.3. Lightweight Processes (LWPs)The threads model in Solaris 10 brings together the user thread, defined internally as a user LWP, and the kernel LWP. As implemented, the user LWP and kernel LWP are abstracted as two different data structures, but because they are so tightly integrated, along with the kernel thread, they should be thought of as a single execution entity. The user LWP is defined in src/lib/libc/inc/thr_uberdata.h. The ulwp_t structure is implementation private and is not intended to be visible to callers of the interfaces (programs), although the structure members can be viewed under a debugger, such as mdb(1). The ulwp_t defines the user state for a thread of execution, which includes the user stack, thread-level scheduling policy and priority, synchronization primitive support (mutex locks, reader/writer locks, condition variables), signal support, and library-level sleep management. Much of the data maintained at the library level and in the ulwp_t exists to support POSIX compliance and features for multithreaded programs. For the record, Solaris ships with two thread APIs: the Solaris and UNIX International (UI) APIs, and POSIX. The Solaris/UI APIs evolved in the very early days of Solaris, before the POSIX thread APIs were completed and standardized. At this point, the POSIX APIs have been stable for quite some time, and we recommend that developers use the POSIX interfaces for developing threaded applications. The underlying implementation in Solaris is the same, no matter which APIs are used. For example, threads can be created with either pthread_create(3C) (POSIX) or thr_create(3C). These interfaces take different arguments, and altering the attribute of a thread is done differently depending on which interfaces are used. The POSIX interface require an additional interface call to change the stack size of a thread, whereas the Solaris/UI interface has an optional stack size in the thr_create(3C) argument list. The interfaces in libc.so serve as wrappers, parsing and validating the argument list. Both create APIs that ultimately call the same library-internal routine for creating the thread. The programmable thread attributes can establish the stack size, stack address, and the scheduling policy and priority. Multithreaded applications typically use synchronization primitives, mutex locks, reader/writer locks, and condition variables for protecting shared data, and POSIX defines settable attributes for these synchronization objects as well. A mutex lock can be defined as having visibility across multiple processes (interprocess) or only within threads in the same process (intraprocess). Refer to the appropriate man pages and the Multithreaded Programming Guide on http://docs.sun.com for a complete list of thread and lock attributes. Another object used internally for user state is the uberdata structure, uberdata_t. There is one processwide uberdata object, which is used internally by the library support code for fast thread management and data access. The uber-data provides a globally visible view of the process's user threads and includes status flags, thread counts, and thread lists. By maintaining a processwide structure in the library, the support code does not have to enter the kernel to retrieve needed bits of information on user thread state. Also, performance optimizations can be made through the use of hash tables and linked lists rooted in the uberdata, allowing the library code to do fast searches and lookups of thread data. The uberdata and ulwp_t data can be examined on running processes with mdb(1). sol10$ mdb -p 18304 Loading modules: [ ld.so.1 libc.so.1 ] > ::uberdata libc.so.1`_uberdata: &link_lock &fork_lock fork_owner +0x0 0xff368bc0 0xff368c00 <NULL> . . . queue_head thr_hash_table hash_size hash_mask +0x1088 0xff380000 0xff260000 1024 0x3ff ulwp_one all_lwps all_zombies +0x1098 0xff3a2000 0xff3a2000 <NULL> nthreads nzombies ndaemons pid sigacthandler +0x10a4 25 0 0 18304 0xff331b20 lwp_stacks lwp_laststack nfreestack stk_cache +0x10b8 <NULL> <NULL> 0 10 ulwp_freelist ulwp_lastfree +0x10c8 <NULL> <NULL> ulwp_replace_free ulwp_replace_last atforklist +0x10d0 <NULL> <NULL> 0xff3a0080 . . . > 0xff3a2000::walk ulwps |::print ulwp_t ul_lwpid ul_lwpid = 0x1 ul_lwpid = 0x2 ul_lwpid = 0x3 ul_lwpid = 0x4 ul_lwpid = 0x5 ul_lwpid = 0x6 ul_lwpid = 0x7 ul_lwpid = 0x8 ul_lwpid = 0x9 ul_lwpid = 0xa ul_lwpid = 0xb ul_lwpid = 0xc ul_lwpid = 0xd ul_lwpid = 0xe ul_lwpid = 0xf ul_lwpid = 0x10 ul_lwpid = 0x11 ul_lwpid = 0x12 ul_lwpid = 0x13 ul_lwpid = 0x14 ul_lwpid = 0x15 ul_lwpid = 0x16 ul_lwpid = 0x17 ul_lwpid = 0x18 ul_lwpid = 0x19 > In the above example, mdb(1) is invoked with the -p flag, to grab a running process (PID 18304 is a threaded test process). Once in mdb(1), the uberdata dcmd is executed, and we can use the uberdata to learn a bit about the process (there are 25 threads, no daemon or zombie threads, etc). We can also use the uber-data pointers to look at the ulwp_t fields of interest. all_lwps is a pointer to the beginning of the linked list of all user threads (ulwp_ts). A ulwp walker in mdb(1) will walk the linked list. In this example, we examine one particular field of each ulwp_t in the process (the ID). The example demonstrates observability into the library-level datauberdata and per-thread ulwp_t data. Note that these structures are implementation private and can change at any time, including with a patch or an update. Where the ulwp_t maintains user statistics, the klwp_t, or kernel LWP, maintains the kernel state of a thread. Most of the above LWP structure members exist to support system calls and to maintain hardware context information. Remember, system calls are function calls into the kernela thread's way of asking the operating system to do something on its behalf (for example, open/read/write a file, get my PID, etc.). Since LWPs can be scheduled on processors (along with their corresponding kernel thread) independently of other LWPs in the same process, they need to be able to execute system calls on behalf of the thread they're bound to. An LWP blocked on a system call does not cause the entire process to block (as long as it's a multithreaded process). Within each LWP, per-thread usage data is maintained, updated throughout the lifetime of the thread. /* * Resource usage, per-lwp plus per-process (sum over defunct lwps). */ struct lrusage { u_longlong_t minflt; /* minor page faults */ u_longlong_t majflt; /* major page faults */ u_longlong_t nswap; /* swaps */ u_longlong_t inblock; /* input blocks */ u_longlong_t oublock; /* output blocks */ u_longlong_t msgsnd; /* messages sent */ u_longlong_t msgrcv; /* messages received */ u_longlong_t nsignals; /* signals received */ u_longlong_t nvcsw; /* voluntary context switches */ u_longlong_t nivcsw; /* involuntary context switches */ u_longlong_t sysc; /* system calls */ u_longlong_t ioch; /* chars read and written */ }; See usr/src/uts/common/sys/klwp.h The usage data is reflected in procfs, accessible programmatically through /proc/ <pid>/lusage and /proc/<pid>/lwp/<lwp_id>/lwpusage. Refer to the proc(4) man page for specifics, and see Section 2.10. The LWP usage data can be observed with dtrace(1).
The above example uses the profile provider, set to fire 97 times per second and targeting a specific process (PID 3015). The sum() function tracks the system call counts per thread (TID key in the sum() aggregation). The output shows the thread ID in the left column and the system call count on the right. Other important bits in the klwp_t support hardware context and state information, signal handling, and procfs support fields. struct pcb lwp_pcb; /* user regs save pcb */ uintptr_t lwp_oldcontext; /* previous user context */ /* * system-call interface */ long *lwp_ap; /* pointer to arglist */ int lwp_errno; /* error for current syscall (private) */ /* * support for I/O */ char lwp_error; /* return error code */ char lwp_eosys; /* special action on end of syscall */ char lwp_argsaved; /* are all args in lwp_arg */ char lwp_watchtrap; /* lwp undergoing watchpoint single-step */ long lwp_arg[MAXSYSARGS]; /* args to current syscall */ void *lwp_regs; /* pointer to saved regs on stack */ void *lwp_fpu; /* pointer to fpu regs */ label_t lwp_qsav; /* longjmp label for quits and interrupts */ /* * signal handling and debugger (/proc) interface */ uchar_t lwp_cursig; /* current signal */ uchar_t lwp_curflt; /* current fault */ uchar_t lwp_sysabort; /* if set, abort syscall */ uchar_t lwp_asleep; /* lwp asleep in syscall */ uchar_t lwp_extsig; /* cursig sent from another contract */ stack_t lwp_sigaltstack; /* alternate signal stack */ struct sigqueue *lwp_curinfo; /* siginfo for current signal */ k_siginfo_t lwp_siginfo; /* siginfo for stop-on-fault */ k_sigset_t lwp_sigoldmask; /* for sigsuspend */ See usr/src/uts/common/sys/klwp.h Recall that the kernel LWP allows user threads to execute system calls, enter the kernel, and (if necessary) block in the kernel, independently of other threads in the same process. Thus, we see syscall support (lwp_ap, lwp_errno, lwp_eosys, etc.), in addition to the execution state fields (lwp_pcb, lwp_oldcontext, lwp_regs, and lwp_fpu). 2.4.4. Kernel ThreadsThe kernel thread is the entity that actually gets put on a dispatch queue and scheduled. This fact is probably the most salient departure from traditional UNIX implementations, where processes maintain a priority and processes are put on run queues and scheduled. It's the kthread, not the process, that is assigned a scheduling class and priority. You can examine this on a running system by using the -L and -c flags to the ps(1) command. The columns in the ps(1) output below provide the process ID (PID), the LWP number within the process (LWP), the scheduling class the LWP is in (CLS), and the priority (PRI). # ps -eLc PID LWP CLS PRI TTY LTIME CMD 0 1 SYS 96 ? 0:17 sched 1 1 TS 59 ? 161:10 init 2 1 SYS 98 ? 0:00 pageout 3 1 SYS 60 ? 721:13 fsflush 172 1 TS 59 ? 0:00 keyserv 172 2 TS 59 ? 0:00 keyserv 172 3 TS 59 ? 0:00 keyserv 7 1 TS 59 ? 0:00 svc.star . . . 6374 1 TS 59 ? 0:00 do1.2686 16961 1 TS 59 ? 0:00 do1.2686 6365 1 TS 59 ? 0:00 csh 17513 1 TS 60 ? 0:00 cp 17501 1 TS 59 ? 0:00 in.rshd 14925 1 TS 59 ? 0:00 in.rshd 13753 1 TS 60 ? 0:01 cp 15771 1 TS 59 ? 0:00 do1.2686 17851 1 TS 39 pts/1 0:00 ps 13751 1 TS 59 ? 0:00 do1.2686 13162 1 TS 59 ? 0:00 csh 7387 1 TS 60 ? 0:02 cp 11886 1 TS 60 ? 0:01 cp 16963 1 TS 60 ? 0:00 cp 10830 1 TS 49 ? 0:01 sshd 17787 1 TS 59 ? 0:00 do1.2686 3245 1 TS 59 ? 0:00 in.rshd 15774 1 TS 60 ? 0:00 cp 17789 1 TS 59 ? 0:00 cp 17612 1 TS 59 ? 0:00 do1.2686 10838 1 TS 59 pts/1 0:00 ksh 17778 1 TS 59 ? 0:00 csh . . . It is interesting to note that the output provides the LWP ID. In Solaris 10, the kernel thread and LWP ID have the same ID value. The kernel thread structure is defined in usr/src/uts/common/sys/ thread.h. The significant fields in the kthread include the following:
The description of the process table showed that a process state field is maintained in the process structure along with the kernel thread. The kernel thread, not the process, changes during execution. There is, for the most part, a correlation between states defined for the process and kernel thread states, as shown in Table 2.2.
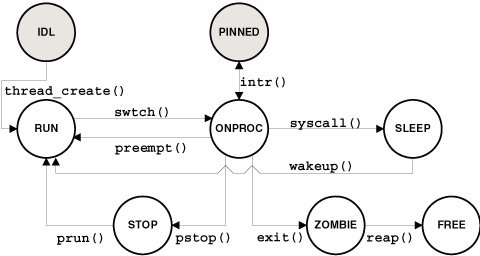
Thread state transitions are shown in Figure 2.6. Figure 2.6. Kernel Thread States The IDL state is actually a process state, and PINNED is not technically a thread state but is shown because it represents a potentially common transition that kernel threads make during execution. The disparities in the state of a process and kernel thread have to do with process creation (process SIDL state) and the state of a kernel thread following termination (TS_FREE). We discuss this subject in Sections 2.7 and 2.9.
The following kernel thread members are used by the dispatcher code for thread scheduling.
The next group of kthread members deals with post-system-call or post-trap handling. The kthread members are embedded in the kthread structure as a union. A bit set in any of these members prevents a direct return to user mode of the thread until the condition has been satisfied.
The thread structure(s) fields can be examined with mdb(1) or dtrace(1). # dtrace -n 'profile-97hz / pid ==26195 / { @p[tid]=lquantize(curthread->t_pri,1,60,5); }' dtrace: description 'profile-97hz ' matched 1 probe ^C 9 value ------------- Distribution ------------- count 1 | 0 6 |@@@@@@@@@@@@@@@ 15 11 | 0 16 |@@@@@@@@@@@@@ 13 21 | 0 26 |@@@@@@@ 7 31 | 0 36 |@@@@ 4 41 | 0 46 |@ 1 51 | 0 6 value ------------- Distribution ------------- count 1 | 0 6 |@@@@@@@@@@@@@ 13 11 | 0 16 |@@@@@@@@@@@@@ 13 21 | 0 26 |@@@@@@ 6 31 | 0 36 |@@@@ 4 41 | 0 46 |@@@ 3 51 | 0 The example shown tracks the priority of all the threads in process PID 26195, using the lquantize aggregating function. lquantize is a good fit here because we know the range of values for the threads in this process (see Section 3.7.1), and lquantize allows us to specify the lower and upper bound for the range of values, as well as the incremental step value (5 in this case). The number at the upper left of each aggregation in the output is the TID, which we used as a key to the aggregation. The value column represents the thead's priority, and the count column represents the number of times during the sampling period the thread's priority fell within the range defined in the value column for that row. Using the dtrace(1) curthread built-in variable, we can track any field in the ktHRead_t structure (curthread is defined by dtrace as being a pointer to the kthread structure of the thread running on the CPU when the probe fires). |
EAN: 2147483647
Pages: 244