Creating a Debugging Mechanism
Creating a Debugging Mechanism
Although a logging mechanism as robust as the one you just created has nearly infinite possibilities forflexibility and storage, sometimes it's far more convenient to print debugging messages to the browserwindow rather than have to pore through a big log file. But just as the Logger class was meant to prevent having dozens of print statements that have to be manually deleted prior to deployment, thedebugging mechanism allows the developer to print messages to the screen in such a way that they caneasily be removed at deploy time.
The Debugger class stores the debug messages in the session, then prints them out at the bottom of ascreen at the end of a page request. This centralizes debug output into one location on the screen, making it easier to find the specific output for which you're looking. It also enables you to print large amounts of data without disturbing the structure of the user interface, and makes suppressing the debug output easy.
The reason we store this information in the session is that not every page request generates output. For example, when saving information to the database by posting a form, you should usually issue a 302 redirect to prevent data modification when a user presses the reload button on his or her browser. A 302 redirect refers to the HTTP response code issued by the browser when you issue code like header('Location: [url]').
Debugger has two primary functions. The debug function writes code to the debug array in the session with an optional key and debug level. The debug level works just like the logging level in the logger class. The lower the logging level value, the higher its priority. The second function is called debug_print and should be invoked at the bottom of every page that generates output. It takes the array from the session and generates an HTML table containing the contents of the array. When it's done printing, it removes the information from the session. In this way, page requests that do not generate output will still have their debugging information preserved.
The code for this class is as follows. Call this class.Debugger.php:
<?php define('DEBUG_INFO', 100); define('DEBUG_SQL', 75); define('DEBUG_WARNING', 50); define('DEBUG_ERROR', 25); define('DEBUG_CRITICAL', 10); class Debugger { public static function debug($data, $key = null, $debugLevel = DEBUG_INFO) { global $cfg; if(! isset($_SESSION['debugData'])) { $_SESSION['debugData'] = array(); } if($debugLevel <= $cfg['DEBUG_LEVEL']) { $_SESSION['debugData'][$key] = $data; } } public static function debugPrint() { $arDebugData = $_SESSION['debugData']; print Debugger::printArray($arDebugData); $_SESSION['debugData'] = array(); } function printArray($var, $title = true) { $string = '<table border="1">'; if ($title) { $string .= "<tr><td><b>Key</b></td><td><b>Value</b></td></tr>\n"; } if (is_array($var)) { foreach($var as $key => $value) { $string .= "<tr>\n" ; $string .= "<td><b>$key</b></td><td>"; if (is_array($value)) { $string .= Debugger::printArray($value, false); } elseif(gettype($value) == 'object') { $string .= "Object of class " . get_class($value); } else { $string .= "$value" ; } $string .= "</td></tr>\n"; } } $string .= "</table>\n"; return $string; } } ?>
The five constants defined at the top of the file define debugging levels that work in exactly the same way as the logging level constants in class.Logger.php. The debug() method expects to find an array called $cfg in the global namespace that contains an element DEBUG_LEVEL which defines the current debug level for the whole application.
By default, the debug level is DEBUG_INFO, though the third parameter of debug() allows you to set it to any level. In this way, you can display as much or as little debugging information as you want by simply altering $cfg['DEBUG_LEVEL'].
The $key parameter is an option label for the information in the debugging array. Though it is second in the parameter list, it will appear in the leftmost column of the table that is eventually produced by debugPrint().
The debugPrint() function just passes the debug information from the session to the printArray() method, which does all the real heavy lifting. After printing the debug information, debugPrint() then blows out the session array to clear the debug information for the next page view.
printArray() takes an array of at least one dimension and prints an HTML table that shows the contents of that array. Multidimensional arrays are properly handled. Objects have only their class name printed.
The following code shows how this class is used:
<?php require_once('class.Debugger.php'); $cfg = array(); $cfg['DEBUG_LEVEL'] = DEBUG_INFO; $myData = array(); $myData[] = 'hello'; $myData[] = array('name' => 'Bob', 'colors' => array('red', 'green', 'blue')); Debugger::debug($myData, 'my data'); $x=5+8; Debugger::debug($x, 'x'); Debugger::debugPrint(); ?> This example is easier to appreciate from Figure 11-1 which shows the output from the debugPrint() function as rendered on the screen.
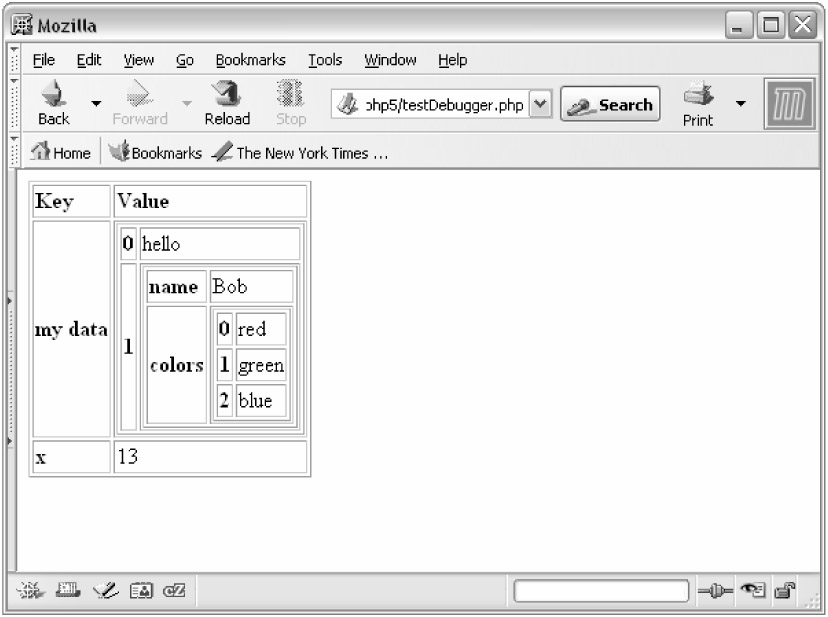
Figure 11-1