Analyzing Network Traffic
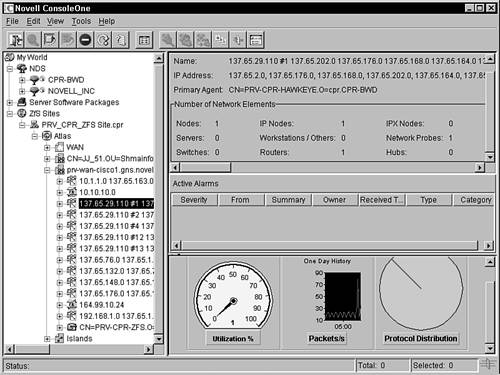
| After you set up the RMON agents and SNMP parameters for the segments and devices on which you want to analyze traffic, you are ready to begin capturing and analyzing network traffic. ZENworks for Servers 3 enables you to monitor and collect detailed real-time statistics from nodes and segments in your network. That information is displayed back to the management console in the form of tables, graphs, and other graphical displays. This section discusses how to use the ZENworks for Servers 3 management console to monitor and analyze traffic on segments, nodes, protocols, and switches. It also covers how to capture and analyze network packets. Analyzing Traffic on Network SegmentsThe most common LAN traffic analysis you will likely be doing is on network segments. You can ensure the most cost-effective, stable, and consistent network by monitoring and managing your segments with ZENworks for Servers 3 traffic analysis. ZENworks for Servers 3 provides several different views for analyzing network traffic on segments. The management views translate the data collected by the monitoring agent into an easy-to-understand graphical and textual form. The following sections discuss how to use the List Segment Statistics, Segment Dashboard, Trend Data, Alarm Statistics, and Summary views on segments to monitor and analyze their traffic. Viewing Network Statistics for a SegmentThe List Segments Statistics view displays a list of segments in your network, as well as the following statistical information for each of them, as shown in Figure 10.3:
Figure 10.3. List Segments Statistics view for a node in ConsoleOne.
Follow these steps from the ZENworks for Servers 3 management console to access the List Segment Statistics view:
Determining Individual Segment PerformanceThe Segment Dashboard view is a graphical view that provides real-time statistical information about an individual monitored segment. Shown in Figure 10.4, it displays four gauges that give the following real-time statistics for that segment, as well as node activity for the top nodes on the segment:
Figure 10.4. Segment Dashboard view for a segment in ConsoleOne.
Follow these steps from the ZENworks for Servers 3 management console to access the Segment Dashboard view:
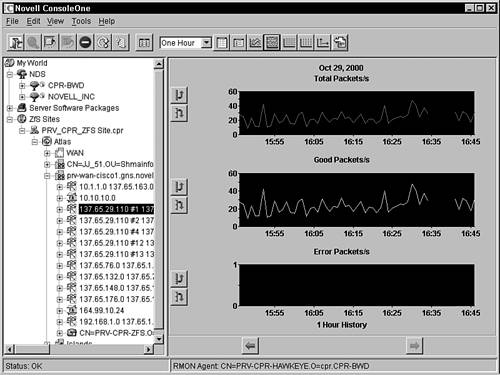
Analyzing Segment TrendsUse the Trend Data view in conjunction with the baseline document, discussed earlier in this chapter. The Trend Data view enables you to determine trends of traffic patterns that indicate that a segment is in trouble or needs to be updated or expanded. To access the Trend Data view for a segment from the ZENworks for Servers 3 management console, follow these steps:
You can configure which statistics to monitor in the Trend Data view. Follow these steps to configure the statistics that best fit your network:
Viewing Alarm Statistics for a SegmentThe Alarm Statistics view shows a list of all alarms for the monitored segment, along with their threshold and sampling rate. Follow these steps from the ZENworks for Servers 3 management console to access the Alarm Statistics view for a segment:
You can edit the alarms manually by highlighting the alarm and clicking the Edit button, or you can use the Default All button to set a predefined set of default values to the alarms. Viewing a Segment SummaryThe Segment Summary view is both a graphical and a textual view, which provides a quick summary of the managed segment. This view enables you to quickly assess the current state of the segment. It provides the following static information about the managed segment:
The Segment Summary view provides the following information about alarms that have occurred on the managed segment:
The Segment Summary view provides the following charts and gauges that show you dynamically captured information about the managed segment:
Follow these steps from the ZENworks for Servers 3 management console to access the Segment Summary view for a segment:
Analyzing Traffic on Nodes Connected to a SegmentZENworks for Servers 3 also provides several views to help you monitor and analyze traffic associated with nodes connected to a monitored segment. Monitoring at the segment level gives you a good understanding about the general trends and health of the entire segment. But if you want to analyze traffic at a more granular level, you need to analyze traffic at the node level. The following sections describe how to use the ZENworks for Servers 3 management console to analyze statistics between nodes, and to monitor nodes for inactivity. Analyzing Network Statistics for Stations on a SegmentThe first thing that you should do when analyzing traffic of nodes on a segment is to gather information about the most active ones. Viewing the statistics for the most active nodes gives you an indication of how active nodes are on the segment and whether any nodes are exhibiting troubled behavior. ZENworks for Servers 3 provides the Stations view to enable you to view the following statistics on the most active nodes in the segment:
Follow these steps from the ZENworks for Servers 3 management console to access the Stations view for a segment:
Analyzing Traffic Between NodesThe Conversations view is another useful ZENworks for Servers 3 view that enables you to view real-time data showing traffic between a specific node and one or more other nodes on the same segment. Use this information when you need to determine communication activity between specific nodes. Suppose you have a database application installed on a node on the segment and you want to see how traffic from this node behaves when the database is active, as opposed to when it is shut down. You would use the Conversations view before and after activating the database and compare the data from each. The Conversations view provides statistical data on the following characteristics of internode communication:
Follow these steps from the ZENworks for Servers 3 management console to access the Conversations view for a node:
Monitoring Nodes for InactivityAnother useful way to monitor network traffic at a node level is to monitor nodes for inactivity. ZENworks for Servers 3 enables you to monitor nodes to determine whether they become inactive and alert you if they do. This does not impact network traffic because the traffic analysis agent does not poll the node to obtain status. Follow these steps from the ZENworks for Servers 3 management console to set it to monitor inactivity of a node:
After you select the nodes that you want to monitor, you can view the following information about them from the Monitor Nodes for Inactivity view:
Follow these steps from the ZENworks for Servers 3 management console to access the Monitor Nodes for Inactivity view:
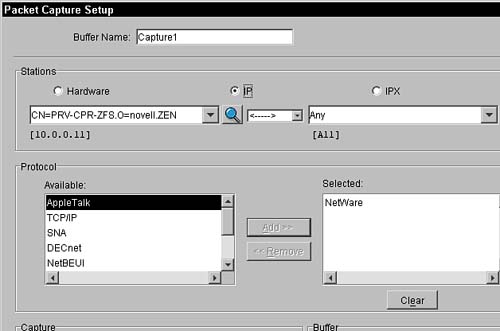
Capturing Packets from the NetworkZENworks for Servers 3 makes it possible for you to be even more detailed than LAN traffic analysis at a node level by enabling you to capture specific sequences of packets from the network. As nodes communicate on a segment, they send packet sequences to each other, which are captured by the RMON agents in a local buffer and can be accessed by the management console. Packet captures provide much more detail to LAN traffic analysis because they provide information about requests and replies that nodes are making on the network. This can be useful in troubleshooting interserver or client-to-server communication issues. The following sections describe how to use the ZENworks for Servers 3 management console to set up a filter and capture packets from the network. Setting Up a Capture FilterThe first step in capturing packets from a segment is to set up a filter to limit the number of packets captured. Without a filter, there would be far too many packets captured, making it extremely difficult to use the capture. Filtering enables you to capture only the packets that are needed. If you are troubleshooting a client-to-server communication issue on an IP application, for example, you would want to capture IP packets only between the client node and the server node. Follow these steps from the ZENworks for Servers 3 management console to define a capture filter:
Starting a Packet CaptureAfter you set the filter, you are ready to start the capture. When you click the OK button from the Packet Capture Filter window, a Capture Status window similar to the one in Figure 10.11 appears. The Capture Status window displays the following information about the capture:
Figure 10.11. Packet Capture Status window for packet captures in ConsoleOne.
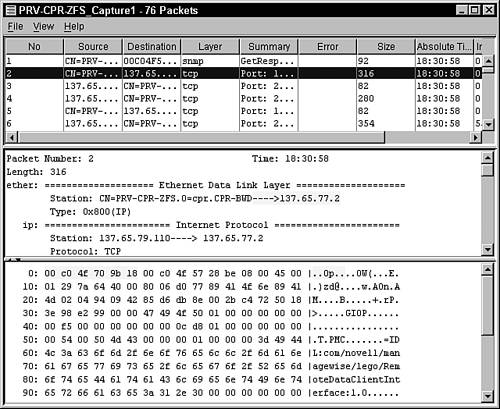
From the Capture Status window, click the Start button to start the capture. If you are trying to capture a specific sequence, start the capture and then perform the sequence for example, open a database file or start an application. When you have captured enough packets, you can click the Stop button to stop the capture, or you can simply wait until the buffer fills up if you specified to stop the capture when the buffer was full. Analyzing Captured PacketsAfter you set up a capture filter and capture the sequence of packets, you are ready to begin analyzing them from the management console. The packet captures reside on the server hosting the RMON agent; however, ZENworks for Servers retrieves the packet data from the RMON agent individually as you view each packet. Viewing Captured PacketsZENworks for Servers 3 provides an extremely useful Trace Display view to help you view and decode packet data. The Trace Display view, shown in Figure 10.12, provides summary information about the captured packets (top), a decoded view of the selected packet (middle), and a hexadecimal view of the packet (bottom). Figure 10.12. Packet capture Trace Display view for packet captures in ConsoleOne.
You can open the Trace Display view by clicking the View button on the Capture Status window or by Selecting Tools The following sections discuss the three different sections of the Trace Display view. Captured Packet SummaryThe summary pane in the Trace Display view displays a list of captured packets, providing you with an overview of the communications between source and destination nodes. You can highlight a packet in this pane to display the decoded and hexadecimal packet data in the panes below. The summary pane provides the following statistical information about the captured packets:
Decoded Packet DataThe decode pane in the Trace Display view displays detailed information about the contents of the selected packet. The packet data is decoded and displayed according to defined protocol fields. This is an extremely useful tool because it tells you information such as the station that sent the packet, protocol, NCP request information, reply results, and so forth. You typically use this field to understand packet sequences and why they failed. Hexadecimal Packet DataThe hexadecimal pane in the Trace Display view displays the raw packet data in hexadecimal format. The column on the left is the hexadecimal offset from the packet header. The second column is the raw hexadecimal data of the packet. The column on the right is the ASCII form of the hexadecimal data. You will likely use only the hexadecimal display if you know exactly what you are looking for. If, for example, you know the structure of the data that is being sent from a client application to a server, you would be able to manually decode the hexadecimal data. The text column of the hexadecimal display, however, is often useful because it shows textual data in the packet. File pathnames, for example, show up in the ASCII column. Filtering the Display for Captured PacketsZENworks for Servers 3 also enables you to filter out packets even after you have begun viewing the packet trace. This is extremely useful in situations where after you begin viewing a packet trace, you narrow down the problem to a specific node or even a specific request. Suppose you originally capture all packets going between a server and all network nodes, but you need to see only the packets going to that server from a specific node. You could filter on only those packets that are going to the specific node you are troubleshooting. Another example is if you know the structure of the exact packet type you want to view. You can filter on a value, such as a key sequence, at a specific offset, and see only those packets that match. Follow these steps to set a display filter for captured packets from the Capture Trace view in ConsoleOne:
NOTE If your packet capture is large, you may have to wait a considerable time for the ZENworks for Servers 3 management console to transfer enough of each packet to filter on. This takes up considerable bandwidth. We recommend that you use the capture filter setting to narrow down your captures first. Highlighting Protocol Fields and Hex BytesOne of the most valuable features of the Trace Display view is its capability to match data in the decoded pane with the hexadecimal values in the hexadecimal pane. It does this by highlighting the data areas that you select in the decode pane, the hexadecimal pane, or in both panes. The following is a list of examples of how you can use the highlighting tool:
NOTE You can save a trace file to a *.tr1 file format so that you can send it to someone else to look at, too, by selecting File Analyzing Protocol TrafficThe ZENworks for Servers 3 traffic analysis agent also enables you to monitor statistics of traffic generated by protocols in your network. Displaying Protocols Used on a NetworkThe RMON2 agent object in the eDirectory tree provides a Protocol Directory property page to view a list of supported and custom protocols used in the network. This is a hierarchical list with the protocols used in the Data Link layer at the top level. Follow these steps from within ConsoleOne to display the protocols used on your network:
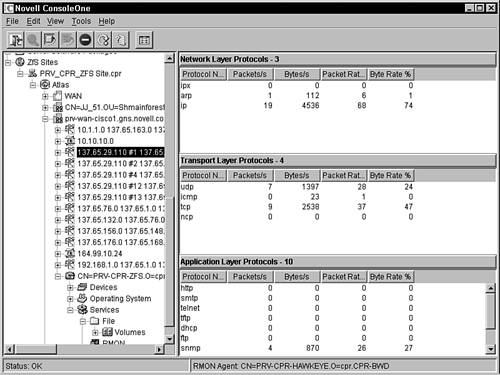
From the Protocol Directory tab, you can also add custom protocols to the supported protocol tree by clicking the Add button. You can also click the Remove button to remove a protocol from being monitored in the tree. Determining Segment Distribution of ProtocolsZENworks for Servers 3 also enables you to view the distribution of protocols on a segment. This gives the following statistics of the protocol communications in the Network layer, Transport layer, and Application layer that are occurring on your network:
Follow these steps from within the ZENworks for Servers 3 namespace in ConsoleOne to view the distribution of protocols in a segment:
Analyzing Switch TrafficThe ZENworks for Servers 3 traffic analysis agent also enables you to monitor statistics of traffic generated on switches in your network. This helps you determine the load on workstation and workgroup switches in your network, enabling you to plan for future upgrades. ZENworks for Servers 3 monitors ports and nodes connected to those ports by using an RMON agent, an external RMON agent, or a bridge agent. The following sections discuss how to use these agents to display statistics for ports on the switches on your network and to view the summarized information for a specific switch. Viewing Port Statistics for a SwitchYou can view a switch's port statistics by using the ZENworks for Servers Unified Port Traffic view. This view obtains statistical information about every port in your network. It then displays a list of nodes connected to ports on the switch and statistics for each port. Follow these steps from within the ZENworks for Servers 3 namespace in ConsoleOne to display the Unified Port Traffic view:
Viewing Switch Summary DataZENworks for Servers 3 also provides a summary view of switch data that provides brief information about the switch. This gives you a quick look at the current status, usage, and alarms generated on the switch. The following statistical information is provided in the switch summary view:
Follow these steps from within the ZENworks for Servers 3 namespace in ConsoleOne to display the Unified Port Traffic view:
|
 List Segment from the main menu and a screen similar to the one shown in Figure 10.3 appears.
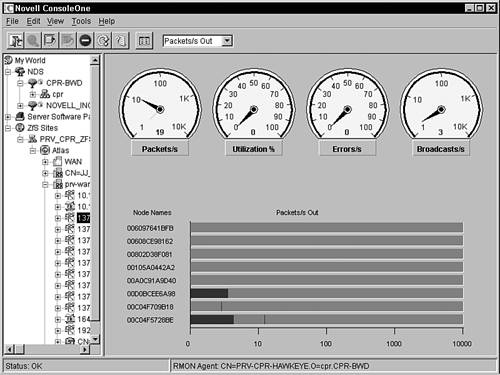
EAN: N/A
Pages: 137