TCO and ROI Equal TCI: Total Cost of Investment
Now that you've seen the outcome of an optimization and tuning effort, you'll take a step back and look at what other forms of analysis models are available to determine the best alternative for your program.
Total Cost of Ownership (TCO) and Return on Investment (ROI) are among some of the most overly used acronyms within the industry today. Both are high-level, analytical models that provide the unwary system manager with an "all bases covered" methodology hype. Vendors have been flogging their wares for more than a decade now using TCO and ROI statements to quantify the value of their product.
With that said, it's not that either of these two models can't provide value. In fact, used correctly and in the correct context, they're both powerful, independently or together.
Let's take a closer look at both models.
Total Cost of Ownership: An Overview
Since its inception back in 1986 by an analyst at Gartner Research, TCO has been increasingly used as the benchmark for determining the overall, medium to long term costs associated with a particular piece of technology. Whether it's software, desktops PCs, servers, or an entire IT project, TCO has been used as the comparative vehicle.
Although TCO has some flaws in its methodology (which you'll see shortly) when used to compare apples to apples, it can provide a well-balanced view of the total cost associated with some form of IT technology investment. This may be a new hardware purchase, a support arrangement, a technology or architectural selection, or an optimization strategy.
By indicating some flaws with TCO, this alludes to the TCO model being an open one. There are little bounds to it, and the outcome is only as good, as valid, or as comprehensive as the input and depth of comparative data used as the basis for the analysis. TCO is also typically only used to model something on a timeframe longer than the implementation itself.
Another example of where TCO breaks is in an example of conducting TCO on the purchase of office desktop PCs. If a TCO analysis on two PC vendors takes into account the cost of the PCs, software, support and installation, and power, how does TCO perform if one vendor's PCs are lower quality yet cheaper? Yes, the TCO based on the purchase price, software, installation, and power is potentially lower, but unless hidden costs can be included into the TCO equation, then it's of little value.
To use a WebSphere-based example, if you attempt to perform a TCO analysis on a WebSphere application platform and attempt to model the TCO based on two differing optimization methodologies, your input must be comprehensive. The inputs should include not only the time and effort to build and design the optimization strategy but also the costs associated with potential changes to hardware, support processes, operational processes, and so forth.
However, if you again use this and change the perspective of time to model two proposed architectures for a new WebSphere installation, you'd include cost items such as these:
-
Hardware (physical servers and disk arrays)
-
Infrastructure software (initial costs for operation systems and other middleware)
-
License costs (WebSphere, operating system, database)
-
Support costs (ongoing vendor support)
-
Deployment costs (operational staff time and effort)
-
Water and feed (power, cooling, fire retardation)
These factors start to provide a good basis for a correct TCO model during implementation.
Another important factor is what I term as soft costs . These are TCO aspects such as potential cost reductions through support staff options (for example, lots of lesser-experienced personnel or fewer experienced personnel), maturity of vendors (for example, response times to support calls and professionalism ), and availability assurances (from vendors). Most often, these elements don't carry a direct dollar value. Instead, they're used as weighting metrics, and I'll explain this in more detail shortly.
I'll now put all of this into some context.
Tables 1-1 and 1-2 compare two basic systems. This example attempts to model the TCO of a WebSphere implementation to determine the optimal system in terms of performance and scalability.
| TCO Element | WebSphere Implementation Option 1, First-Year Costs |
|---|---|
| Hardware costs | Two — Intel Pentium 4 servers = $30,000 |
| Infrastructure software | Operating systems and Enterprise Application Integration (EAI) middleware = $15,000 |
| License costs | WebSphere, Oracle, and operating system = $10,000 |
| Support costs | Hardware and software support = $15,000 |
| Operational support costs | 24 —7 support = $50,000 |
| Deployment costs | Integration team — four personnel = $20,000 |
| Water and feed | Power, air conditioning, and fire-retardant system = $5,500 |
| TOTAL First Year | $145,500 |
| TCO Element | WebSphere Implementation Option 2, First-Year Costs |
|---|---|
| Hardware costs | Three — Intel Pentium 4 servers = $45,000 |
| Infrastructure software | Operating systems and EAI middleware = $20,000 |
| License costs | WebSphere, Oracle, and operating system = $15,000 |
| Support costs | Hardware and software support = $25,000 |
| Operational support costs | 24 —7 support = $50,000 |
| Deployment costs | Integration team — two experienced personnel = $20,000 |
| Water and feed | Power, air conditioning, and fire-retardant system = $8,500 |
| TOTAL First Year | $183,500 |
As you can see from Table 1-1 and Table 1-2, Option 1 for the first year is the cheaper alternative ”or, it has a lower cost of ownership. If you added scalability as a soft metric and worked on a 75-percent usage growth per annum, the outcome would look different. For example, if these examples were specified to handle 100 concurrent users, the Option 1 (Table 1-1) servers may each be operating at 50-percent load and Option 2 (Table 1-2) at 35-percent load.
If the annual plan to increase concurrent users serviced by the application was an additional 75 percent (an additional 75 users), the Option 1 servers would be nearing 90-percent utilization, or saturation point. The Option 2 servers would be operating at approximately 60-percent load each (getting high but reasonable). Option 1 therefore would require a doubling of infrastructure in the second year, as well as additional software and licensing to service the additional servers.
Figure 1-10 compares the costs of these options for two years .
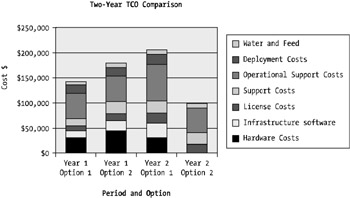
Figure 1-10: A two-year TCO comparison of both options
Therefore, as depicted in Figure 1-10, a two-year view on the TCO, based on the inputs from Tables 1-1 and 1-2, would show that Option 1 would become more expensive over time than Option 2.
The reason is this: Option 2 doesn't need an upgrade in the second year. The costs are fixed and known. When an upgrade is required, this would incur a deployment cost (see Tables 1-1 and 1-2 for associated costs) for each upgrade. To then include soft metrics such as the impact to availability and scalability of the solution, Option 2 starts to pull away from Option 1, boasting an increasingly better TCO. Obviously, three servers are more scalable ”albeit to a point ”than two servers, and the additional server provides a higher level of availability.
Although this may not accurately represent a real-world scenario, the concept is sound. Projects and people typically underestimate the hidden costs such as development and training when formulating TCO.
This section showed that when performing analysis on an optimization and tuning plan to determine the most cost-efficient or cost- rewarding direction, you should consider the context in which you model the TCO. Use apples-to-apples comparisons, and don't be afraid to use complexity or the perceived value of something (for example, vendor track record) as a consideration.
Now that you're starting to learn about cost rewards or cost efficiencies, you're starting to get closer to the ROI model.
Return on Investment: An Overview
An ROI of a positive of negative nature is an important aspect to be aware of with any system or application implementation. Business cases tend to use a number of derived ROI models such as Net Present Value (NPV).
ROI is best used to predict or model the future cost efficiency of an investment, such as the deployment of a WebSphere-based application on a commodity Intel platform versus a higher-grade environment such as a Sun UltraSPARC III platform.
ROI differs from TCO in that TCO was designed to model the outright total cost of something (such as a total WebSphere platform), and ROI was designed to model the financial benefit or return of something in the future.
For example, you may use an ROI model to determine the financial benefits and general return (a.k.a. bang for buck) between two WebSphere optimization strategies ”one being to simply install more hardware, such as CPUs and memory, and the other being to physically tune the WebSphere application server engine.
Let's focus on that example for a moment.
Using the set of metrics discussed in the previous section, let's use a scenario where the Chief Information Officer (CIO) has requested an audit of the systems and applications that run within your WebSphere environment. The audit is to perform a review of the cost per transaction for the applications operating within the WebSphere application environment for which you're responsible. The cost for each transaction is made up of system cycles (CPU power), processing capacity of the application server, and time taken to complete the transaction.
The audit is completed, and the results are that the cost per transaction is too expensive ”$10 per transaction!
Your next step is then to look at optimizing your WebSphere application environment (using this book, of course). After planning an executing a performance and optimization strategy, you perform an ROI analysis.
In this example, if it took the following to optimize your WebSphere environment, the cost for strategy compilation, execution, and reporting, the program would cost $20,000:
-
Ten days to build and test the performance and optimization strategy at $500 per day (you and your team's time)
-
Five days to test the strategy in an integration/stress and volume environment at $500 per day
-
Two days to implement the solution
-
Three days to compile the performance monitoring statistics post-solution deployment
The resulting cost per transaction, after a successful reduction of processing overhead within the WebSphere application environment, was $2.50 (or 75 percent). Therefore, assuming 100,000 transactions per month, you can say, simplistically speaking, the ROI of this effort of $20,000 is 97 percent. That is, for an investment of $20,000, the successful optimization effort produced a monthly positive return (saving) of 97 percent from the pre-optimization platform performance characteristic.
Measuring this type of benefit is important. System managers and architects need to be able to report and represent, as well as view and identify, the bottom line return that will be achieved by investing time and effort into a performance methodology and upgrading hardware.
EAN: 2147483647
Pages: 111