Measuring Business Improvements
It's all well and good to understand the obvious technical benefits of optimizing and tuning, but you need to understand the impact, both positive and negative, that this effort entails. You may be able to tune the JVM settings and notice a difference in the performance of the application or overall environment, but what about the tangible benefits to a business? As discussed, business sponsors and stakeholders will want to see benefits from a business perspective. That is, they'll want to see a decrease in operational, support, licensing, infrastructure, and other costs or an increase in customer usage, satisfaction, and, ultimately, transaction rate (which may or may not drive revenue, depending on the type of application you're tuning).
I'll discuss this topic more, in context, throughout the rest of this book; however, it's worth covering some of the key business impacts that are measurable from optimization and tuning efforts.
The following two scenarios show how business benefits are measurable with performance optimization and tuning:
-
Scenario 1 looks at a fairly new application that's in pilot mode. Problems have been found with the application's performance, and failure to improve the performance will most likely result in the application being cancelled.
-
Scenario 2 discusses the cost benefits of optimization for a platform that's requiring an upgrade in end user capacity. It explores the alternatives and highlights the bottom line cost benefit from optimization.
Scenario 1: A Pilot Application
As you've seen, the outcome of all optimization efforts for a business is an impact to the bottom line (hopefully a positive one). If WebSphere optimization and tuning is conducted properly, you'll see a positive effect on the budget sheets.
The positive impact may not be so clear initially; however, over time the benefit realization will accelerate and become more obvious. An example of this would be an optimization and tuning effort conducted while an application is new or in pilot phase.
A pilot phase typically includes a small handful of test or trial users testing an application or system. Some people call this a live production shakeout, but effectively it represents a pilot phase of the application development life cycle. If the pilot phase, making use of only 10 percent of expected total number of users, showed that the response times were hovering around the 90-percent to 95-percent mark of the acceptable Service Level Agreement (SLA), this would provide an obvious case for optimization and tuning efforts.
For example, let's say an acceptable response time for a WebSphere-based application was five seconds per transaction, and during the pilot, with 10 percent of the targeted application load, pilot users were reporting four-second response times.
Now, unless the application operating in WebSphere had externally controlled constraints that meant four seconds would be the norm even for up to 90 percent of the total projected end user load, typical capacity modeling would suggest that transaction response times increase as the user load does. Given that norm, if 90 percent of the acceptable response time was being reached with 10 percent of the projected end user load, then there's a problem!
| Note | Of course, stress and volume testing should have picked this up in preproduction deployment; however, this doesn't always happen. It's amazing how often stress and volume testing isn't conducted or isn't conducted properly. Never go live (or permit an application to go live) into production without proper stress and volume testing. |
At this point, there would be several scenarios that may play out.
If the platform had been sized and modeled by the capacity planners and system architects (typically those reading this book) according to the functional and technical specifications, then this would serve as a baseline for operational performance. However, the input to the platform and application performance modeling is just as critical as the output of the model itself.
In this situation, given that the system performance characteristics are broken, proposing an optimization and tuning exercise of the WebSphere application environment is the only sensible course of action.
Let's assume that some stress and volume testing or profiling had taken place once the performance problem had been realized (I'll go through profiling in later chapters of the book). The output of the profiling would identify poorly operating application code and areas within WebSphere that could be tuned to extend the life of the application in its current state.
The alternative would be to purchase additional hardware and, based on the previous example, lots of it. Mind you, as discussed earlier, it may be a dual-pronged plan ”a combined hardware and optimization change.
Measuring the business impact of either solution is straightforward. The baseline cost would be initial implementation. Additional effort to analyze and ensure the application operates within the guidelines set out in the SLA would require funding. Further, depending on the outcome of the analysis, additional hardware or funding for an optimization and tuning effort would be required.
The costs associated with the Scenario 1 project are as follows :
-
Initial hardware purchase: $250,000
-
Initial development costs: $300,000
-
Projected ongoing costs: $50,000 per annum
Let's look at the two options available to this problem: a hardware upgrade or optimization effort. You can assume that to achieve the SLA required with an additional 90-percent load, you'll need at least a 100-percent increase in additional infrastructure or a 100-percent increase in platform optimization (which effectively means a 100-percent improvement in performance capacity).
The following are the costs for Option 1, a hardware upgrade:
Additional projected ongoing costs: 5,000 per annum (additional support for operations and hardware) Additional hardware required: 0,000 TOTAL 5,000 for year one
The following are the costs for Option 2, an optimization and tuning effort with minimal hardware upgrade:
Projected ongoing costs: ,000 per annum (additional ,000 per annum for increased ongoing optimization and tuning program) Projected costs for tuning effort: ,000 Projected costs for code changes: ,000 Additional hardware required: ,000 TOTAL 5,000 for year one
Figure 1-8 depicts these two options side by side.
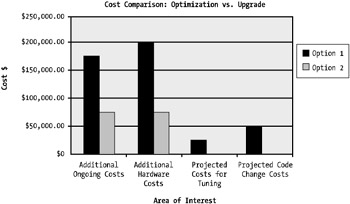
Figure 1-8: Comparing costs of both options
The two options side by side are fairly self-explanatory. Although these costs are examples, they do show the differences in associated costs for a scenario such as this. Specifically, a 100-percent improvement in performance through optimization is in most cases achievable. Even 200 percent isn't a difficult task.
Essentially, the business benefits of improving performance through an optimization and tuning program far outweigh the benefits or costs associated with an upgrade in hardware. The business benefit, although driven by a reactive requirement (in other words, post-deployment cleanup), is $150,000.
Figure 1-9 depicts a second-year view on this scenario. This figure indicates the ongoing savings associated with the initial outlay. The key factor that's driving the increase in cost savings is the ongoing cost for hardware support.
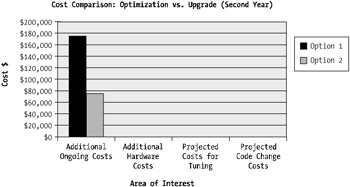
Figure 1-9: The second-year cost comparison of both options
Scenario 2: A Request for Additional User Capacity
Scenario 2 looks at a platform with an e-commerce application, one that has been operating within a WebSphere environment for some time.
In this scenario, if a requirement comes from business sponsors or the company's marketing group that indicates additional users are being targeted through a marketing campaign, you'll need to investigate the state of the WebSphere and application platform to determine the impact and whether any action is required.
As previously mentioned in Scenario 1, two clear options exist in this type of situation. You can undertake a straight hardware increase, based on capacity modeling, or you can facilitate an effort to investigate and ultimately optimize and tune the WebSphere platform.
Typically, you can undertake a baseline of an optimization and tuning strategy quickly and with fewer overhead and impact than a production hardware upgrade. If an optimization and tuning methodology is in place and performance management is a key part of this particular scenario's operations architecture, undertaking a review of the WebSphere platform's performance will incur a minimal incremental cost. Even optimization and tuning that doesn't involve developers can significantly increase the performance of a WebSphere implementation. Modifying JVM settings, transaction management controls, queues, and similar aspects of the environment can result in a large result-to-effort ratio.
In this situation, activating a series of performance monitors that capture the characteristics and workload of the WebSphere environment will provide the key indicators for a review. Once metrics have been captured, then analysis and review can take place. This typically takes one to five days, depending on system complexity and size (at least highlighting several of the key areas of the platform).
Next, planning the WebSphere optimization and tuning effort based on the analysis obtained from the metrics provided by the performance monitors and then planning, testing, and implementing the changes typically requires an additional five to ten days for a midsize system.
All in all, this effort takes approximately ten days; assuming a system manager rate of $500 per day, the outlay would be $5,000.
Again, let's assume an increase in performance of 100 percent was obtained ”for this example, let's say the analysis found that several Java database connection methods were serialized, causing all database transactions to queue up behind one another. This is a common problem I've seen in smaller environments where connection pooling within WebSphere wasn't used and a custom-written pool or database connection manager was employed.
Without proper analysis of what was happening "under the covers" using a sound performance methodology, a hardware upgrade would've been costly. A hardware upgrade may not have even resolved the issue, given that the example states the problem is a serialization of the connection beans to the database.
One may have looked at running additional WebSphere instances to allow more concurrent database connections (meaning a higher volume of serialization and bank of database requests but still a higher throughput of queries). This would require additional CPU and memory on the WebSphere application server to provide capacity for running multiple WebSphere application server instances.
Additional hardware costs mean additional licenses and support. Figure 1-8 highlights the difference between the optimization approach and the hardware approach ”both options would achieve the same outcome. The hardware costs detailed in Figure 1-8 are based on public pricing details available on the Internet (to be nonbias, I've averaged the cost per CPU and memory between several Unix server vendors , based on entry-level servers). Again, please keep in mind these costs are examples only and are an attempt to show the business improvements and the measurement of these improvements over time; however, their impact and realization is accurate.
Therefore, in summary, measuring business improvement or the effect on a business's bottom line when tuning and optimizing is simply about weighing these tangible costs. I don't want to imply that to gain performance the only option is to optimize and tune and not to perform hardware upgrades. This isn't the case; in many situations ”and I'll go through more of these later in the book ”a combined approach of hardware and optimization is the most logical.
EAN: 2147483647
Pages: 111
- Chapter V Consumer Complaint Behavior in the Online Environment
- Chapter VI Web Site Quality and Usability in E-Commerce
- Chapter XV Customer Trust in Online Commerce
- Chapter XVI Turning Web Surfers into Loyal Customers: Cognitive Lock-In Through Interface Design and Web Site Usability
- Chapter XVII Internet Markets and E-Loyalty