Working with Breakpoints
| < Day Day Up > |
| Breakpoints can be set
Each type of breakpoint is described in detail in the following sections. Line and Taglib BreakpointsWhen you encounter an error in an application's response, your immediate task is to find the code responsible for the problem. One way to detect the code is to halt the application's running at the points suspected of causing problems. To help you do this, Workshop Debugger provides line breakpoints ; the application halts at these breakpoints when running the code. This gives you an opportunity to examine the different parts of the application, such as variable values, running threads, and executed methods . Eventually, examining this information enables you to discover the code responsible for breaking the application. In the Model-View-Controller (MVC) pattern, if line breakpoints are used to debug the View component, which is a JavaServer Page (JSP), browser caching is turned off during debugging. If a taglib is used in the JSP, you could set a taglib breakpoint that allows stepping through the code in the tag class. To set a line breakpoint, follow these steps:
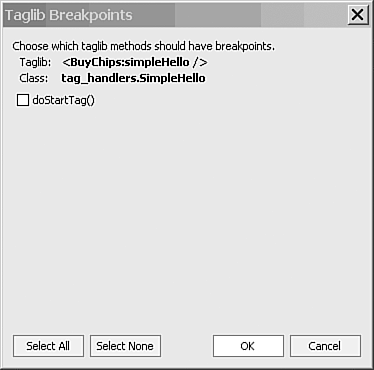
Setting a taglib breakpoint requires the following steps:
Workshop provides other ways to set or remove a line breakpoint:
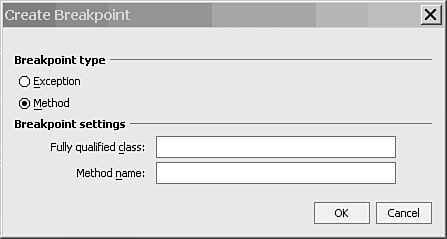
Method BreakpointsFrequently, instead of halting the code at a particular line, you might want to halt execution at the start of a method and step through it, observing the values of the different variables used in it. To do this, you can use method breakpoints , even with overloaded methods. However, there are two options in these cases:
To set a method breakpoint, follow these steps:
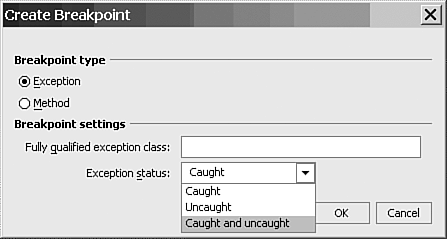
Figure 5.3 shows an example of setting a breakpoint on the checkapproval method. Figure 5.3. Setting a method breakpoint. For overloaded methods, include the argument list with the method name to restrict setting the breakpoint to that one method. Exception BreakpointsBecause exceptions are where you specify the behavior that should occur in the event of an error, exceptions are a key area to set breakpoints when debugging an application. Workshop enables setting breakpoints on an exception or any of its subclasses. Three choices are available when setting an exception breakpoint:
Follow these steps to set an exception breakpoint:
The Clear All Breakpoints command enables you to permanently clear all breakpoints, which you can also do by pressing Ctrl+F9. To temporarily remove breakpoints, you can disable them rather than clear them and enable them again when you need them later. To do this, select Disable All Breakpoints or Enable All Breakpoints from the Debug menu. |
| < Day Day Up > |
EAN: 2147483647
Pages: 138