Setting Debugging Properties for a Project
| < Day Day Up > |
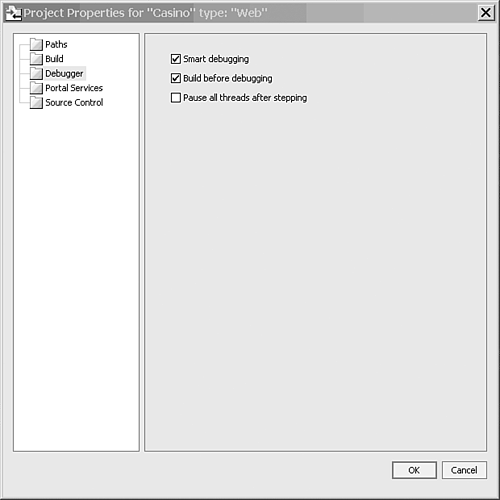
| Because applications in Workshop are created as projects, you can set three properties related to debugging the project, as shown in Figure 5.1. The following sections describe these properties in more detail. Figure 5.1. Setting debugging properties for a project. Smart DebuggingIf you select the Smart Debugging option, classes provided by WebLogic Platform are filtered out. For example, if your code calls a method within a WebLogic Server class, after the method is executed, the focus is returned to your code. You set a breakpoint on your code. If the Smart Debugging option is selected, the Debugger skips the method provided by WebLogic Server and goes directly to your code. When you create a Web application using Workshop, a number of built-in classes are used, so for Web applications you would always leave this property selected. For an EJB project, however, you might choose to deselect this option because you might not use any built-in classes. Building Before DebuggingBuilding an application simply means compiling the code in all the files and packaging it as an Enterprise Application Archive (EAR) file. Setting this property ensures that the entire Java project is built before running the Debugger. For a Web application, the build is executed on the current file, so if you're running the Debugger on a Page Flow, only that particular JPF is compiled instead of all the files. Pausing All Threads After SteppingExecution threads are one of several parts you should view when debugging an application. By default, the Debugger window displays the currently running thread, but at times you might need to view all the threads. If so, select this check box to view all the threads, not just the currently running thread, in the Threads window. Keep in mind that viewing the currently running thread, which is the default behavior, is better for performance. If you don't enable this property, but decide after debugging starts that you need to view all threads, select Debug, Pause from the menu. This pauses all breakpoints and displays all threads in the Threads window.
For Java and control projects, because there's no way of testing without a parent application, you must set additional debugging properties, described in the following list, by going to the Project Properties dialog box:
The properties dialog box also includes an option to specify whether you want to start a new JVM to test this project or use an existing one. |
| < Day Day Up > |
EAN: 2147483647
Pages: 138

 The different types of breakpoints and how to set them are explained a little later in this chapter. For an introduction to breakpoints,