Adding Drill-Down Links to Web Presentations
You can add hotspots to most SAS/GRAPH Web presentations. The hotspots enable a user to select an element of a graph to open a Web page showing either another graph or related information. See the following sections for basic information on adding links to Web presentations:
-
Links in GIF, JPEG, and PNG Files on page 571
-
Links in ACTXIMG and JAVAIMG Images on page 571
-
Links in Java and ActiveX Web Presentations on page 571
-
Links in Metaview Applet Presentations on page 572
-
Links in Treeview Diagrams on page 572
-
Links in Constellation Charts on page 573
-
Links in Critical Success Factor Diagrams on page 573
-
Links in Animated GIFs on page 573.
Links in GIF, JPEG, and PNG Files
To add a hotspot link to static images generated with the GIF, JPEG, and PNG device drivers, use the HTML= option or HTML_LEGEND= option or both, with a SAS/GRAPH procedure as described in Adding Links with the HTML= and HTML_LEGEND= Options on page 574. The links are implemented in an HTML image map. The elements in the graph, such as bars or pie slices, become selectable hot spots in the Web presentation. In your SAS program, drill-down URLs are defined in a data set variable. SAS generates the image map for you in the HTML output file.
A complete example of hotspots created in this way is shown in GIF Output with Hotspot Links on page 452.
Links in ACTXIMG and JAVAIMG Images
To add a hotspot link to an image created with the ACTXIMG device driver and a GBARLINE, GCHART, GPLOT (except for high-low ), or GRADAR procedure, use the HTML= option as described in Adding Links with the HTML= and HTML_LEGEND= Options on page 574.
SAS/GRAPH does not directly support hotspots for Web presentations created with DEVICE=JAVAIMG. You can, however, create an image map for the resulting PNG file using any image-map tool available to you.
Links in Java and ActiveX Web Presentations
The ActiveX Control and two of the SAS Java applets (Graph and Map) support four implementations of links in Web presentations. Hotspots are not supported for contour diagrams in either the ActiveX Control or the Contour applet.
To specify the drill-down mode, use the DRILLDOWNMODE parameter as follows (for more information, see Configuring Drill-Down Links with ACTIVEX on page 392):
ODS HTML PARAMETERS=
-
("DRILLDOWNMODE"="LOCAL""SCRIPT""URL""HTML");
Local mode (Graph applet only)
-
responds to drill-down actions by dynamically generating and displaying new graphs based on a subset of the data in the selected graph element. In this mode, the graphic to be displayed is generated by the applet from data it already has (rather than being a pre-existing HTML page that you have created yourself). At each drill-down level, the user can configure the graph type, data subset, variable roles, and colors.
Script mode
-
calls a JavaScript method that you specify in your SAS/GRAPH program, and passes to that method information on the selected graph element or map region. It is up to you to write the JavaScript to respond to the mouse-click. You can use the data passed to the JavaScript function to determine what part of the diagram was clicked on and, therefore, what URL is appropriate to link to. This is the default drill-down mode for the Map applet.
URL mode
-
displays URLs that are provided by link variables. The link variables are identified to the graphics procedure with the HTML= option. The URLs identify pre-existing HTML files that you will have created yourself. The drill-down functionality of the URL mode is similar to the drill-down functionality that is provided by the GIF, JPEG, and PNG device drivers.
HTML mode
-
generates drill-down URLs based on a substitution pattern that you specify in your SAS/GRAPH program. The Graph applet and Map applet complete the URL by inserting the specified data from the graph element that was selected in the drill-down action. An example link specified in HTML mode is the following:
ods html file=statepop.htm parameters=("DRILLDOWNMODE"="HTML" "DRILLPATTERN"='http://www.state.{&statename}.us'); -
In this example, the value of the data set variable STATENAME completes the drill-down URL.
-
Note: The variable must be used in the chart. It is not sufficient that it simply be in the data set.
Any mode (Graph applet and ActiveX control)
-
attempts to implement each of the four drill-down modes in succession until a valid Web destination is found. The order of the attempts is Local (Graph applet only), Script, URL, and HTML.
Links in Metaview Applet Presentations
To generate drill-down presentations for the Metaview applet, use either the HTML= or HTML_LEGEND= options or both and an enhancement variable, as introduced in Adding Links with the HTML= and HTML_LEGEND= Options on page 574.
Links in Treeview Diagrams
You can add hotspots to Treeview diagrams so that when a user selects a node another Web page is opened. The easiest way to add hotspots is to include the URL to be linked to in the SAS data set from which the Treeview is generated. For example, the following data set specifies a different URL for each observation:
data father_and_sons; input id . name . father . url .; cards; aaron Aaron Parker http://www.yourdomain.com/aaronparker.html bob Bob Parker aaron http://www.yourdomain.com/bobparker.html charlie Charlie Parker aaron http://www.yourdomain.com/charlieparker.html david David Parker aaron http://www.yourdomain.com/davidparker.html edward Edward Parker david http://www.yourdomain.com/edwardparker.html ; run;
A simple, but complete example is shown in Treeview with Hotspots on page 510.
Links in Constellation Charts
You can add hotspots to Constellation diagrams so that when a user selects a node another Web page is opened. The easiest way to add hotspots is to include the URL to be linked to in the SAS data set from which the diagram is generated, as is done for Treeview diagrams as shown in Links in Treeview Diagrams on page 572. A simple example of a Constellation diagram with hotspots is shown in Constellation Chart with Hotspots on page 524.
Links in Critical Success Factor Diagrams
You can add a hotspot to a critical success factor diagram created with the DS2CSF macro. However, unlike the Treeview and Constellation macros, you can add only a single hotspot to the diagram, i.e., the diagram as a whole. The following code fragment links to the specified URL when a user clicks anywhere on the diagram. The DRILURL= option specifies the URL to link to, while DRILTARG=_self specifies that the new Web page is to be displayed in the same window as the dial.
%ds2csf(data=test, var=x, htmlfile=u:/public_html/Web_output/csf.html, openmode=replace, pagepart=head, center=y, drilurl=http://www.sas.com, archive=rvapplet.jar, /* specify the complete url for the jar file */ /* if it is not in same directory as the html file */ /* archive=http://sww.sas.com/avd/codebase/rvapplet.jar, */ csftyp=classic, septype=none, cback=#e0e0e0, bgtype=color, bg="#e0e0e0", ttag=bold + italicized, tcolor="#002288", tsize=5, tface="Arial, Helvetica", range=sashelp.javagrf.sample1.range)
Links in Animated GIFs
SAS/GRAPH does not directly support inserting hotspots into animated GIFs. If you want to enable linking from an animated GIF, you must use whatever third-party tools are available to you. You can also make the entire image a hotspot by including the <IMG> tag inside an <A HREF=> tag.
Adding Links with the HTML= and HTML_LEGEND= Options
The HTML= and HTML_LEGEND= options can be used in a number of statements that generate graphs. These options are be used to add drill-down links to Web presentations that are generated with the following device drivers:
-
GIF, JPEG, or PNG
-
JAVA and ACTIVEX
-
JAVAMETA
In these Web presentations, the HTML= and HTML_LEGEND= options identify a variable that provides drill-down URLs. This variable is referred to as a link variable because of its use in establishing links.
The HTML= and HTML_LEGEND= options are also used to implement a number of different enhancements to Web presentations that run in the Metaview applet. In this case, the variables that are identified by the HTML= and HTML_LEGEND options are referred to as enhancement variables because of their broader use than just establishing links.
Working with Link and Enhancement Variables
To use link or enhancement variables in a Web presentation, you need to define those variables, add data to those variables, and then identify those variables in the HTML= option or HTML_LEGEND option or both.
The following code fragment defines a link variable named RPT and assigns that variable a length of 40 characters :
data regsales; input Region State Sales; length rpt
Be sure to define your link variable with a length that will be sufficient to contain your URLs (plus the HREF= option). The maximum length is 1024 characters.
The values of the link variable use the following syntax:
-
'HREF= URL < anchor-name >'
This syntax is used in the following example:
RPT='href="reports.html#west"';
The following table lists the valid values of the link variable:
| Value Assigned to a Link Destination Variable | Implications |
|---|---|
| HREF="< path >reports.html" HREF="< path >reports.html#west" | Tells the browser to look in the file reports.html. If < path > is not provided, the file must be in the same location as the HTML file that initiates the link. For the value that has #west, go to the output with the anchor name west. Users must have access to your file system in order to access the link target. |
| HREF="http://www.company.com/web/reports.html" | Tells the browser to go to the Web site address http://www.company.com/web and look in the file reports.html. |
| HREF="http://www.company.com/web/reports.html#west" | For the value that has #west, go to the output with the anchor name west. Users must have access to the Web to follow the links. |
| HREF="#west" | Go to the target with the anchor name west. The target must be referenced or contained in the same HTML file as the drill-down graph that contains the link. For example, if the drill-down graph is in the file sales.html, then the target output must be referenced or contained in sales.html. Because this target is in the same file as the drill-down graph, this link will work whether the output is viewed within your file system or across the Web. |
Assigning Values to Link and Enhancement Variables
The most obvious method of adding these variables to your data set is to manually add them to the desired observations in your data set. This method is not practical or feasible in many cases, in which case you can use IF/THEN statements or variable substitution.
The following picture shows how link variables are assigned to a bar chart. The three bars represent regional sales for a company s central, southern, and western regions .
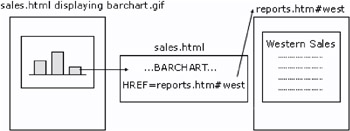
Figure 22.1: Links in Drill-Down Graphs
Each bar in the chart needs to link to a different anchor tag in an HTML file named reports.html. The anchor names in the linked file are central, south, and west. The following DATA step uses an IF/THEN statement to assign values to the link variable.
/* create data set REGSALES */ data regsales; length Region State $ 8; format Sales dollar8.; input Region State Sales; length rpt ; /* the link dest. variable */ /* assign HREF values to link dest. variable */ if Region='Central' then rpt='HREF="reports.html#central"'; else if Region='South' then rpt='HREF="reports.html#south"'; else if Region='West' then rpt='HREF="reports.html#west"'; /* create a chart that uses the data tip variable */ proc gchart data=regsales; vbar3d region / sumvar=sales patternid=midpoint html=rpt; run; datalines; West CA 13636 West OR 18988 West WA 14523 Central IL 18038 Central IN 13611 Central OH 11084 Central MI 19660 South FL 14541 South GA 19022 ;
The following table shows the values in the data set REGSALES.
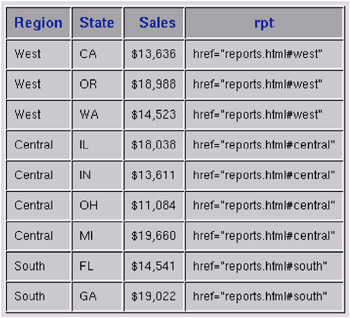
Display 22.1: Values in the REGSALES Data Set
To illustrate the use of variable substitution, assume that you are developing for the Metaview applet a presentation that uses the HREF drill-down mode of linking. You need to add an enhancement variable to each observation in the data set. The value of that variable is a URL that has a common base and a filename that is derived from a variable in the data set. The following example defines the base URL, defines an enhancement variable, and uses variable substitution to assign values to the enhancement variable.
%let htmlpath=http://webServer1/graph/javameta; data yearsonly; set prdsummary(where=(_type_ eq 2)); length htmlvar 0; htmlvar='href='quote("&htmlpath/y"put(year,4.)'.htm'); run; In the preceding example, the values of the enhancement variable HTMLVAR are URLs. Each URL combines the base address in HTMLPATH with the value of the YEAR variable and a filetype of HTM.