PerfMon
PerfMon is an MMC snap-in designed for performance monitoring. Like the Task Manager, PerfMon is supplied by Microsoft and comes with the Windows operating system on W2K and WXP. It is similar to the Task Manager to the extent that its main purpose is to pull performance data from various performance counters on the system, and to display the data in a user-friendly format. However, PerfMon is much more sophisticated, and in particular allows you complete freedom to choose which performance counters are used. The cost of this flexibility is that PerfMon takes a little longer to learn to use to its full potential, but it is a tool that's well worth experimenting with. It can supply a lot of information about not only the resources used by running application, but also in some cases what the application is doing. For example, you can use PerfMon to find out the rate at which managed exceptions are being thrown.
One other difference between PerfMon and the Task Manager is that PerfMon makes no effort to hide the fact that it is getting its data from performance counters. This means that in order to work with PerfMon, you need to have some understanding of performance counters. In contrast, it is possible to use Task Manager extensively without ever being aware of the existence of performance counters.
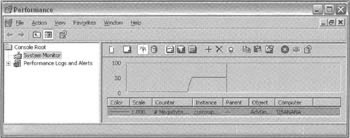
To launch PerfMon, just type perfmon at the command prompt. This brings up a window that looks something like this:
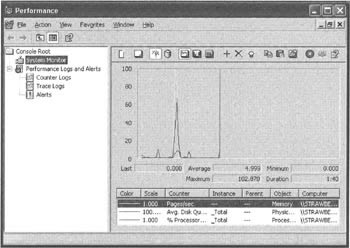
The System Monitor node in the MMC treeview reveals a time graph showing how selected performance counter measurements vary with time, similar to the Performance tab in Task Manager. Although it's not clear in the screenshot, the final vertical line in the graph moves steadily to the right as more data is gathered, and the graph restarts as soon as the vertical line reaches the edge of the window. If you run PerfMon you'll immediately see this happening.
Each line in the graph corresponds to a particular performance counter. You can remove individual counters from the graph by selecting the appropriate counter in the listview and either hitting the Delete key or clicking on the x-shaped icon above the graph. You can add new items to be graphed by clicking on the + sign. This brings up a dialog box asking which performance counters you want to examine:
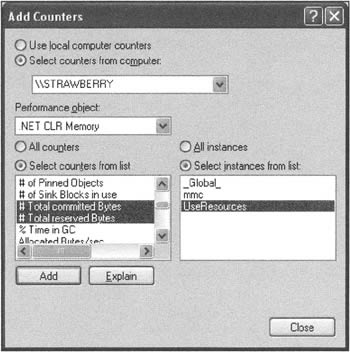
In this screenshot I have selected to examine two counters, which respectively measure the total committed and reserved bytes that the garbage collector has claimed for the managed heap in the process (it's the same example we developed earlier in the chapter, which I left running for this screenshot). The dialog box also illustrates a couple of concepts that we need to be aware of. An individual performance counter monitors just one quantity. There are a huge number of performance counters on your system, and these are divided into categories. In the above screenshot the selected counters come from the category, .NET CLR Memory. Although category is a more meaningful term and is the term used in .NET, the term used in the context of unmanaged code is performance object - and PerfMon still uses this term, as shown in the screenshot. Once you have chosen the performance counters to use, you also need to indicate the instance. You can think of the counter as being analogous to a class, and the instance to an object. The performance counter tells you what type of quantity you will be monitoring, but you also need to specify which process or part of the computer system is going to be monitored - you can think of this as instantiating a performance counter for this process (though I stress this is only an approximate analogy). The _Global_ instance will monitor the totals for all processes. (Note however that there are certain counters that may not be appropriate to individual processes.). The above screenshot offers a choice of the two running applications - the UseResources example, and MMC itself (the application that's running PerfMon). Note that the system makes no distinction between .NET-related performance counters and other performance counters and so will allow you to instantiate a .NET-related counter for an unmanaged application - although clearly all .NET-related measurements are likely to be zero for an unmanaged process.
When I OK'd this dialog box I got the following (after the graph had been allowed to run for a short time):
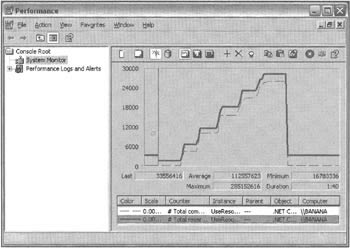
The vertical scale is measured in kilobytes (you can change the vertical scale by right-clicking on the graph, selecting Properties from the resultant context menu then using the Graph tab of the dialog box that will appear). While PerfMon was running, I clicked on the 50MB button in the UseResource example five times, and then clicked the button to free the memory. You can clearly see the five periods when memory was being allocated. It is also clear that the final memory allocation took substantially longer. By this point, the virtual memory required by UseResources was pushing at the limits of the available RAM (the machine this was running on had 256MB RAM), which means that pages would need to be extensively swapped out to the hard drive. This should demonstrate the potential for using PerfMon to get some fairly detailed information about any excessive resource use by an application.
The .NET Performance Counters
So far, although I've given you a fair idea of how you can use performance counters, I've not said very much about exactly what .NET-specific data you can monitor with the available counters. In fact, as of .NET version 1.0, the CLR provides nine categories of performance counters:
| Category name | Counters can supply information about... |
|---|---|
| .NET CLR Exceptions | Frequency with which exceptions are thrown, and exception handling blocks are executed. |
| .NET CLR Interop | Frequency with which calls to unmanaged code are made, either by P/Invoke or through COM Interop. |
| .NET CLR JIT | Time taken to JIT-compile code, and number of bytes compiled. You can use this information to get an idea of whether new code that has not been previously executed is being run, since that is the code that will be JITted. |
| .NET CLR Loading | Rate of loading assemblies, classes, and so on. |
| .NET CLR LocksAndThreads | Numbers of logical and physical threads, and the rate at which threads fail to acquire locks. |
| .NET CLR Memory | Amount of memory in heaps, and the frequency with which garbage collections are performed. |
| .NET CLR Networking | Numbers of bytes and datagrams sent/received. |
| .NET CLR Remoting | Numbers of context-bound objects and remoting objects, and frequency with which remoting calls are made. |
| .NET CLR Security | Frequency with which security checks are made. |
In addition to these, there are a number of performance counters specifically geared towards ASP .NET.
As we'll see when we start coding with performance counters, in order to instantiate a particular counter you normally supply strings giving the category, counter, instance, and possibly the machine name. The category names are listed in the above table. You can find the specific counter names by:
-
Looking up the information in the MSDN documentation (at ms-help://MS.VSCC/ MS.MSDNQTR.2002APR.1033/cpgenref/html/gngrfperformancecounters.htm).
-
Checking the list of names in the PerfMon Add Counter dialog, or from the VS.NET Server Explorer (just locate the Performance Counter node under the relevant computer name).
-
There are also methods in the System.Diagnostics.PerformanceCounterCategory class to enumerate names - we'll cover this next.
I should stress that the above list only indicates the performance counters that are supplied as part of the CLR. These form but a small fraction of the total performance counters available on Windows.
Coding with the Performance Counters
Besides using the performance counters in tools such as PerfMon, it's very easy to manipulate them directly in your code. This means that your code can do its own performance monitoring, or you can write some code to monitor some other process or aspect of the system. The relevant classes are in the System.Diagnostics namespace, and the key class is System.Diagnostics.PerformanceCounter. You can instantiate a performance counter by specifying the category name, counter name, and instance name in the constructor:
PerformanceCounter counter = new PerformanceCounter(".NET CLR Memory", "# Total committed bytes", "_Global_");
There are a number of other constructor overloads, including one that allows you to specify the machine the counter is to run on (the default is the local machine).
Once the counter is instantiated, you need to initialize it. This is done by calling BeginInit():
counter.BeginInit(); BeginInit() sets the initialization process off on a separate thread and returns immediately. If you have some action you want to take, but you need to make sure the counter is fully initialized first, you can call EndInit(), which simply waits until the counter is initialized:
counter.EndInit(); In when we cover threads, we'll say more about the BeginXXX()/EndXXX() design.
Then, whenever you need to read the value of a performance counter, invoke the NextValue() method. This method returns a float (to take account of the fact that some counters return floating point data, while others return integers - so if you know a particular counter returns integer data, you'll need to cast the return value).
int numBytesInHeap = (int)Counter.NextValue(); If the counter is not yet fully initialized, NextValue() will block until it has been initialized.
If you want to find out about available performance counters, you can use the PerformanceCounterCategory class. The static GetCategories() method returns an array of PerformanceCounterCategory objects representing the possible categories.
PerformanceCounterCategory[] cats = PerformanceCounterCategory.GetCategories();
Alternatively, if you know the name of the category you want, you can instantiate a category directly. Once you have a PerformanceCounterCategory object, you can find out what instances are available (the categories are arranged so that all counters in the same category have the same set of instances):
PerformanceCounterCategory cat = new PerformanceCounterCategory( ".NET CLR Memory"); string[] instances = cat.GetInstances();
You can also obtain an array containing all the counters that are available for a specific instance:
PerformanceCounter[] counters = cat.GetCounters("_Global_"); Note that some categories cannot break up their data by process. Such categories only have one instance, and there are different overloads of the methods shown in the above code snippets to cover this possibility, as well as different overloads of methods to allow you to instantiate a counter for a remote machine. As always, full details are in the MSDN documentation.
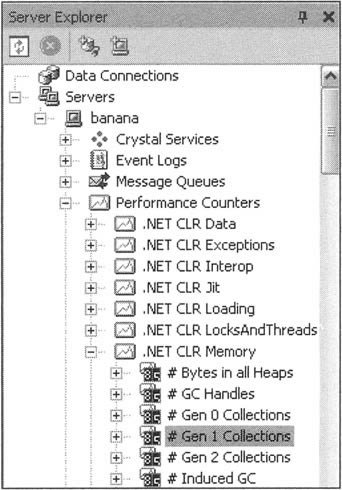
VS.NET also does a lot to make your coding with performance counters easy. In particular, the Server Explorer can show you a list of the registered counters, as shown in the following screenshot:
This makes it very easy to find out the exact strings that you need to supply to the relevant constructors to instantiate performance counter related classes. You can even drag a counter from the Server Explorer to the design view to get VS.NET to auto-generate the code to instantiate a counter. However, the work you save by doing this is minimal, and the code you get is quite inflexible - in particular since it gives you a counter hardwired to a particular machine name, with all initialization performed in the InitializeComponent() method. I personally find it easier to just write the code for a performance counter myself, and that's the approach I take in the next example.
The MonitorUseResources Example
In this section we'll develop a short example that illustrates the use of performance counters. It's a development of the UseResources example, which monitors and displays one aspect of its own resource use as it runs: the number of generation 0 and generation 1 garbage collections that have been performed.
When running, the example looks like this:
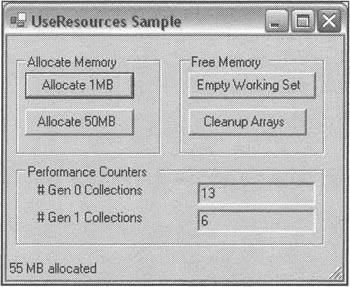
To create the example, I took the code for UseResources and made a few changes. First, I added the new controls you can see in the screenshot from the Toolbox. I also added a timer and used the Properties window to set the timer to enabled and its interval to 1,000 ms (one second). I also set the names of the textboxes to tbGen0Collections and tbGen1Collections.
We need a couple of fields in the Form1 class to represent the performance counters
PerformanceCounter pcGen0Collections; PerformanceCounter pcGen1Collections;
Next I added this code to the Form1 constructor:
public Form1() { InitializeComponent(); this.pcGen0Collections = new PerformanceCounter(".NET CLR Memory", "# Gen 0 Collections", "MonitorUseResou"); this.pcGen0Collections.BeginInit(); this.pcGen1Collections = new PerformanceCounter(".NET CLR Memory", "# Gen 1 Collections", "MonitorUseResou"); this.pcGen1Collections.BeginInit(); this.label1.Text = this.pcGen0Collections.CounterName; this.label2.Text = this.pcGen1Collections.CounterName; } You could argue that I may as well have set the text for the labels in the Properties window, but doing it this way makes sure they contain the correct text for the appropriate counter (and makes the name more robust against anyone later changing which counters are displayed).
Finally, I added this code to the timer's Tick event handler:
private void timer_Tick(object sender, System.EventArgs e) { this.tbGen0Collections.Text = this.pcGen0Collections.NextValue().ToString(); this.tbGen1Collections.Text = this.pcGen1Collections.NextValue().ToString(); }
Running this code you can watch the garbage collections accumulate as you allocate more bytes of array. You'll notice that generation 1 collections don't start happening too frequently until you've allocated quite a bit of memory - at which point the garbage collector is seriously looking for memory it can reclaim. Although I haven't shown generation 2 collections in the sample, you would see the frequency of those collections rising too.
Registering Your Own Performance Counter
We're now going to develop the MonitorUseResources example to illustrate how you can define your own performance counter. The new example is called CustomPerfCounter and looks like this when running.
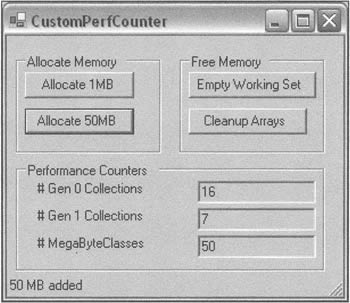
It's very similar to the MonitorUseResources example, except it shows an additional performance counter (category: AdvDotNet, counter name: # MegaByteClasses created, instance name: CustomPerfCtr) This counter is registered and controlled by the sample itself and shows the total number of MegaByteClass instances that have been created since the program started running. To prove that this is a real performance counter that can be viewed by other applications, you can start up Perfmon while the sample is running and add the custom counter to the counters displayed by Perfmon:
To achieve all this in the code, we first need a new field in the Form1 class to hold the counter (as well as the new text box and label that I added from the Toolbox). We also declare some strings that give the names of the new category, counter, and instance, as well as help texts. (If you run Perfmon, you'll see that the help texts appear as descriptions when you browse for counters to add).
PerformanceCounter pcGen0Collections; PerformanceCounter pcCommittedBytes; PerformanceCounter pcMegaByteAllocs; string categoryName = "AdvDotNet"; string counterName = "# MegaByteClasses created"; string categoryHelp = "Advanced .NET Sample Counters"; string counterHelp = "Counts total MegaByteClass allocations"; string instanceName = "CustomPerfCtr";
The code to register the new counter, along with the new counter category, AdvDotNet, looks like this:
private void RegisterCustomCounter() { if(!PerformanceCounterCategory.Exists(categoryName)) { PerformanceCounterCategory.Create(categoryName,categoryHelp, counterName,counterHelp); } pcMegaByteAllocs = new PerformanceCounter(categoryName, counterName, instanceName, false); pcMegaByteAllocs.RawValue = 0; }
We are using a couple of new methods on PerformanceCounterCategory here. Exists() checks whether a category exists - clearly we shouldn't try to register the category if it's already there. Create() registers the specified category as well as one counter in the category (there's a different overload of Create() for registering categories that contain more than one counter). Finally, we use a slightly different overload of the constructor to PerformanceCounter(). The overload we are using here has an extra bool parameter indicating whether the access to the counter is to be read-only (the default). We set this to false since our code needs to be able to write to the counter. Finally, we set the data for this counter to initially be zero (no MegaByteClass instances created).
Notice the way that instantiating a PerformanceCounter object really has created a new performance counter instance - as in a genuine Windows object that can be seen by Perfmon, for example. What's actually going on is that the PerformanceCounter constructor checks to see if a performance counter of the named machine, category, object, and instance already exists and has been registered with the performance counter architecture in Windows- and if so hooks up to that counter. Otherwise it creates a new performance counter instance and registers it.
The RegisterCustomCounter() method is called from the Form1 constructor. The sample also contains a method to remove the counter and the AdvDotNet category, which is called from the Dispose() method of Form1:
private void DeregisterCounter() { if (PerformanceCounterCategory.Exists(categoryName)) PerformanceCounterCategory.Delete(categoryName); }
In a real world application, you might prefer to leave the counter permanently registered, but this is only a sample and I'm guessing that if you download and run the code, you won't want the extra performance counter cluttering up your system after you've finished playing with the sample! This does mean that the AdvDotNet category only exists while the sample is running - which means that if you want to use Perfmon to examine it, then you'll need to launch the sample before Perfmon.
Finally we need to update the counter whenever we instantiate MegaByteClass.
public void AddArray() { arrays.Add(new MegaByteClass()); this.pcMegaByteAllocs.RawValue += 1; }
Strictly speaking this is updating the counter whenever we add an instance to the array of MegaBytesClasses that is stored in the Form1 class, but you get the picture.
That's all we need to do to register and update the counter. However, since the sample is maintaining the counter, we may as well display its value along with the values of the other counters while we're at it. So here's the new timer tick event handler:
private void timer_Tick(object sender, System.EventArgs e) { this.tbGen0Collections.Text = this.pcGen0Colleetions.NextValue().ToString(); this.tbCommittedBytes.Text = this.pcCommittedBytes.NextValue().ToString(); this.tbMegaByteAllocs.Text = this.pcMegaByteAllocs.RawValue.ToString(); } The new counter is displayed using the RawValue property instead of the NextValue() method. We don't have space to go into the distinction in detail here - full details are in the documentation. Basically, there are different types of counter - for example our counter has a simple number that is set. Some counters form their values by incrementing or by taking the difference between the last two values. The nature of the counter determines which method/property is most appropriate for retrieving a value.
EAN: 2147483647
Pages: 124