Operating System Heaps
|
Although you thought I might be done with the heap system after so many pages, there's another set of heaps you'll definitely want to know about—the operating system heaps. As an application starts under a debugger, Windows turns on the operating system heap checking. This heap isn't the C run-time library debug heap; it's the Windows heap code for those heaps created with the HeapCreate API function. The C run-time library heap is a separate entity. Because processes use the operating system heaps extensively, for example, to do ANSI to Unicode string conversion when using ANSI functions, you might see information related to operating system heaps in your normal operation, which is why it's important to cover them here. If you attach a debugger to your application rather than start your application under the debugger, you won't activate the operating system heap checking. One of the most common questions I get is: "My application runs fine outside the debugger, but when it runs under the debugger, it has a User breakpoint exception. Why won't my application run?" The answer is the operating system heap checking.
With the operating system heap checking turned on, your application will run slightly slower because the operating system heap checking will validate the heap when your application calls a heap function. This book's code samples include a program named Heaper that corrupts the heap. When you run Heaper under a debugger, you'll see that it calls DebugBreak twice on the first HeapFree. Additionally, you'll see output such as the following that shows what was wrong. Yes, the output stops at "of a" and doesn't show the size of the block, which would be quite useful. If you run the program outside the debugger, it runs to completion without reporting any problems.
HEAP[Heaper.exe]: Heap block at 00311E98 modified at 00311EAA past requested size of a
![]() HEAPER.CPP is shown in Listing 17-5.
HEAPER.CPP is shown in Listing 17-5.
Listing 17-5: HEAPER.CPP, a Windows heap corruption example
void main(void) { // Create an operating system heap. HANDLE hHeap = HeapCreate ( 0 , 128 , 0 ) ; // Allocate a 10-byte block. LPVOID pMem = HeapAlloc ( hHeap , 0 , 10 ) ; // Write 12 bytes to a 10-byte block (an overwrite). memset ( pMem , 0xAC , 12 ) ; // Allocate a new 20-byte block. LPVOID pMem2 = HeapAlloc ( hHeap , 0 , 20 ) ; // Underwrite 1 byte on the second block. char * pUnder = (char *)( (DWORD_PTR)pMem2 - 1 ); *pUnder = 'P' ; // Free the first block. This call to HeapFree will trigger a // breakpoint from the operating system debug heap code. HeapFree ( hHeap , 0 , pMem ) ; // Free the second block. Notice that this call won't report // a problem. HeapFree ( hHeap , 0 , pMem2 ) ; // Free a bogus block. Notice that this call won't report a problem. HeapFree ( hHeap , 0 , (LPVOID)0x1 ) ; HeapDestroy ( hHeap ) ; } If you're using your own operating system heaps, or you'd like to have the application turn on operating system heap checking outside the debugger, you can turn on some additional flags to receive more diagnostic output. The Debugging Tools for Windows package includes a small utility named GFLAGS.EXE. With it, you can set some of the global flags that Windows checks when it first starts an application. Figure 17-1 shows GFLAGS.EXE set up for HEAPER.EXE, which is the program in Listing 17-5. Many of the System Registry and Kernel Mode options are global, so you need to be extremely careful if you set them because they can have a major impact on system performance or can make your machine unbootable. Setting Image File Options, as shown in Figure 17-1, is much safer because the settings are limited to just that one executable. Keep in mind that although GFLAGS.EXE is useful, you can also use the Application Verifier tool to check for heap corruptions, which I'll discuss later in the chapter.
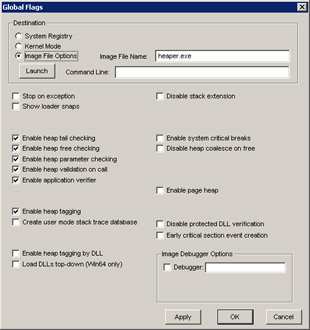
Figure 17-1: GFLAGS.EXE with settings for HEAPER.EXE
Because I'm on the subject of GFLAGS.EXE, I want to take a moment to point out one very useful option, Show Loader Snaps. If you check that box and run your application, you'll see where Windows is loading the DLLs and how it's going about fixing up the imports, called snapping, for your application. If you need to see exactly what the Windows loader is doing when it loads your application (in case you have a problem), you'll find it helpful to turn on this option. For more information on loader snaps, see Matt Pietrek's "Under the Hood" column in the September 1999 Microsoft Systems Journal.
|
EAN: 2147483647
Pages: 177