Tricks for Hunting Down Memory Problems
|
With a good understanding of the debugging memory systems available to you, I can now turn to tricks and techniques for finding those memory problems that occur only in production systems and don't easily show up in the debugger.
Finding Uninitialized Memory Writes
Nothing is worse than a crash that occurs out of nowhere and that doesn't seem to match up with any known code path. If you're experiencing these symptoms, you're probably looking at an uninitialized write, which is also known as a wild write. The cause is a pointer variable that hasn't been initialized and happens to be pointing to valid memory. You'll mostly see this with stack-based pointers, in other words, local variables. Since the stack is being changed all the time as your program is executing, there's no telling what that uninitialized pointer is pointing to, which is why it can appear to be random.
When my company is brought in to help track down one of these insidious problems, we invariably find a team that's at wits' end. When we first meet with the team, someone will tell us that the team has literally tried every possible trick to find the problem. Since they've already done "everything," they're desperate to see what magic we'll do to solve the problem. My response is that we'll have to use the patented and trademarked Magic Ninja Uninitialized Memory Debugging Technique (MNUMDT). Everyone's sitting on the edge of his or her seat waiting for the trick— especially when I mention that the MNUMDT works only if I have the two least experienced developers on the team work with me to find the bug.
By this point the two junior developers are champing at the bit to get going and show the rest of the team they can seriously carry their weight. I have the two come around and stand by me as I spell out the MNUMDT:
-
The two developers and I are each going to take one third of the code.
-
Each of us is going to read each line of code looking for any pointer declarations.
-
When we find a pointer declaration, we're going to initialize that pointer to NULL if the pointer isn't initialized in the declaration.
-
For each non-class memory allocation we find, we're going to add a call to memset or ZeroMemory after that call to zero out the memory.
-
When we find a deallocation, we'll initialize the pointer value back to zero after the deallocation.
-
When we encounter a memset, or string copy operation, we're going to verify that each operation properly calculates the memory block size.
-
Each class member variable is initialized in the constructor(s).
When I get through the MNUMDT list, the two developers are ready to run out of the room, but because I have them stand next to me, I can grab them and prevent it. If you're thinking that this sounds like a lot of grunt work and a brute force approach, you're exactly right—that's what it is.
Having looked for thousands of uninitialized memory bugs now, I've found that no amount of fancy debugging will get you close. All you'll end up doing is wasting a ton of time. It's much more efficient to go through and follow the steps I just outlined before starting the debugging. The odds are extremely high that one of those pointers we initialize will be the one with the problem. Now, instead of corrupting memory and continuing to run, the application will crash immediately because it's trying to write to NULL.
Some of you might think this won't work, but I can give you hundreds of instances where teams have spent weeks looking for the problem and didn't get anywhere. However, when we were brought in, we were able to find the problem in a day or two. Sometimes developers try to outsmart themselves because they don't want to think about brute force. However, brute force is an excellent technique in this case. If you're wondering why I ask for the two junior developers on the team, I've found that they don't make as many assumptions as senior developers and with the eyes of the whole team on them, they are super-conscientious about the work they do grinding through the code.
Finding Memory Overruns
Between the DCRT and tools like Compuware's BoundsChecker, you should have scrubbed out all the memory overruns in your application as part of your testing. Sadly, not everyone is testing to the level that readers of this book are, and you'll have to find those pesky overruns in those developers' code. Additionally, some of the memory overruns occur only under the most stressful production situations. To make matters worse, when a release build application overruns memory, there's no slop space on the end of the memory block, so the overrun can subtly corrupt data that you might not notice for weeks, until the server application crashes.
One of the weaknesses of the DCRT overrun checking is that the overrun is reported only after the fact when a memory operation triggers the run through to check for them. It would be better to find a way to immediately stop the instant a program bashed memory just outside its allotted space. Inside Microsoft, they needed a testing tool that would do just that and a few years ago released a tool called PageHeap.
PageHeap is actually baked into the operating system and uses a unique trick to catch those overruns instantaneously. When you allocate 16 bytes, PageHeap actually allocates 8 KB! It allocates a 4 KB page, the smallest block of memory that can have access rights applied to it. PageHeap marks that allocated page with read and write access. PageHeap allocates the very next page in memory directly behind the read/write page and marks that page as no access. PageHeap does some pointer arithmetic and hands your program an address that is 16 bytes off the end of the first page. Thus, when you write into the seventeenth byte off that address, you'll write into the page marked as no access so you immediately access violate. Figure 17-2 shows the layout of a PageHeap allocation so that you can visualize what's happening.
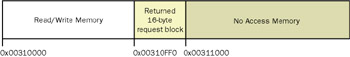
Figure 17-2: PageHeap allocation
As you can imagine, PageHeap uses a ton more memory than normal. However, the cost is dirt cheap if it helps you find the memory overrun. If you've got a large application, slap as much memory as possible into the test machine so that your application will turn over. Go ahead and steal some out of your manager's machine because he or she won't miss it.
One key item I do need to mention about PageHeap is that all pointers returned to you have to be on a 16-byte boundary. That means if you allocate 10 bytes, you'll have to overrun by 7 bytes in order to hit the no access page. The good news is that normally when people overrun a block, it's not just by a byte or two but by a whole gob of them, so PageHeap should still catch them. This also means that PageHeap is worth your while only if you're running a release build of your application. With the debug build padding the memory allocation for its own overrun and underrun bytes, you'll never see the PageHeap overrun crash.
Application Compatibility Toolkit
Although I could walk you through a huge discussion of turning on PageHeap with the weird command-line tool built into GFLAGS, there's a much better way to do it. The Application Compatibility Toolkit (ACT) not only brings PageHeap functionality right into Visual Studio .NET but offers some excellent bug detection tools you should definitely know about. Much of ACT is geared toward helping IT administrators get applications running on Microsoft Windows XP and Windows Server 2003, but the Application Verifier (AppVerifier) portion of ACT is where the developer action is.
ACT is offered with this book's sample files, or you can download the latest version from http://www.microsoft.com/windowsxp/appexperience/default.asp. The documentation says that ACT 2.6, the version available to me as I write this book, indicates that AppVerifier runs on Microsoft Windows 2000 SP3 and later, but I've had luck only on Windows XP and Windows Server 2003. On Windows 2000, I've never gotten the AppVerifier to work properly. Additionally, some of the tests and errors the documentation says should work don't seem to produce any output. For the rest of this discussion, I'll assume you are using Windows XP or Windows Server 2003 when running AppVerifier and are running under an account with Administrator privileges (as required for AppVerifier).
AppVerifier has been designed as a standalone executable (APPVERIF.EXE) and as an add-in (VSAPPVERIF.DLL). The AppVerifier add-in included with ACT version 2.6 is integrated into the Debug toolbar of Visual Studio .NET 2002. However, that integration is not migrated over to Visual Studio .NET 2003. Fortunately, because of all the experience I got with add-ins back in Chapter 9, I was able to figure out how to get the AppVerifier add-in working. If you're using a later version of the AppVerifier add-in, it will probably integrate directly into Visual Studio .NET 2003, so you can skip the following steps to make it work.
After you've installed ACT, open a command prompt and navigate to the <ACT installation directory>\Applications directory. You'll need to register the AppVerifier add-in DLL with REGSVR32 VSAPPVERIF.DLL so that the COM components are in the registry. The next step is to tell Visual Studio .NET 2003 about the add-in. In the AppVerifierAddIn directory with this book's sample files is a .REG file named ![]() AppVerifierAddInReg.reg.REG. You can either double-click the .REG file from Windows Explorer or execute it with REGEDIT
AppVerifierAddInReg.reg.REG. You can either double-click the .REG file from Windows Explorer or execute it with REGEDIT ![]() AppVerifierAddInReg.REG.
AppVerifierAddInReg.REG.
In case you're wondering whether bringing an add-in written for a previous version of Visual Studio .NET over to a newer version can be a problem, let me tell you that it can be. If the add-in happens to be written using .NET, pulling in a previous edition of the CLR could cause problems. However, in the case of the AppVerifier add-in, it's written only in C++, so it's safe. I could tell this because I was running REGASM on VSAPPVERIF.DLL, and REGASM reported that the add-in wasn't a .NET assembly. Of course, I still went through and tested all the options in VSAPPVERIF.DLL to ensure everything was safe. If you happen to run Visual Studio .NET with the AppVerifier add-in under an account where you don't have Administrator privileges, you'll get an odd error message box. The title of the box is "Installer Error" and the text is "Error: insufficient permissions to run this program. Administrator access needed."
Once you install ACT or register the AppVerifier add-in manually, you might miss the new buttons added to the Debug toolbar of Visual Studio .NET. This new Debug toolbar is shown in Figure 17-3. You'll need to make the Debug toolbar visible when you aren't debugging because you can set AppVerifier add-in options only before you start debugging. One of the key tenets of the AppVerifier add-in is that it will cause DebugBreak calls left and right when you encounter a problem, so you're always going to be running under a debugger. By having it built into Visual Studio .NET, you can avoid the pain of Windows NT Symbolic Debugger (NTSD) or WinDBG.
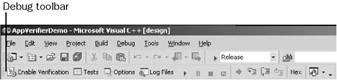
Figure 17-3: Visual Studio .NET Debug toolbar after properly configuring the AppVerifier add.in
The first thing you'll need to do with the AppVerifier add-in is turn on an option that isn't documented but will provide better memory error detection. After loading a project in Visual Studio .NET, on the Debug toolbar, click the new Options button, and in the Options dialog box, check the Use Full Page Heap option as shown in Figure 17-4. This option is not available in the standalone APPVERIF.EXE program, and more checking is always better. Figure 17-4 also shows that I haven't checked Break In The Debugger After Each Logged Event. If this checkbox is checked, you'll be stopping every 15 nanoseconds as the AppVerifier add-in reports something.
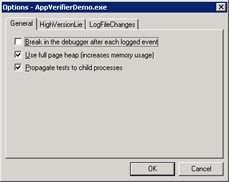
Figure 17-4: The AppVerifier add.in Options dialog box inside Visual Studio .NET
Clicking the Tests button on the Debug toolbar brings up the AppVerifier Test Settings dialog box in which you can specify which tests to run. The tests are all described in Table 17-4. Additionally, I turn on all the tests shown in Figure 17-5. The items set in the AppVerifier Test Settings dialog box are on a per-process basis, so you'll need to set them for each application you want to run under the AppVerifier add-in.
| Test | Description |
|---|---|
| Detect heap corruptions | This test performs regular checks of the heap and adds guard pages at the end of each allocation to catch possible heap overruns. |
| Check lock usage | This test looks for common errors associated with critical sections. |
| Detect invalid handle usage | With ACT 2.6, this test checks only whether handles are NULL/INVALID_HANDLE_VALUE or a TLS parameter is bad. |
| Check for adequate stack | This test checks for adequate stack in Win32 services. You probably won't use this test. |
| Log start and stop | This option simply enters log information when the application starts or stops. This helps to make the logs easier to read when reviewing test data. |
| Checks system path usage | This test monitors the application's attempts to obtain file path information to see if the program uses hard-coded paths, or a non-standard method of gathering the information. |
| Checks version handling | In the past, many applications have been written to run on a single version of Windows. This test will return a very high version number when the application attempts to determine which version of Windows it's running in. |
| Checks registry usage | This test monitors the application's use of the system registry for any inappropriate or dangerous calls. Any problems detected will be logged. This test helps to ensure future compatibility for applications because it checks for the usage of specific registry keys that might be dropped or changed in future versions of the Windows operating system. |
| Logs changes to Windows File Protection files | This test logs changes to Windows File Protection files. |
| Logs DirectX file checks | This test logs any attempts that an application makes to perform a version check on DirectX libraries. |
| Logs registry changes | This test logs to an XML file all changes that an application makes to the registry. |
| Logs file system changes | This test logs to an XML file all changes that an application makes to the file system. You'll receive a warning if the application attempts to write files to the %windir% or Program Files folders. |
| Logs calls made to obsolete APIs | This test logs calls made to APIs that have been marked as obsolete in the Microsoft Platform SDK. When using this test, only look for log entries with your binaries in the log. The operating system itself makes quite a few obsolete calls. |
| Logs installations of kernel-mode drivers | This test logs any attempt made by an application to install a kernel-mode driver. |
| Logs potential security issues | This test detects and logs potential security issues when using NULL DACL security descriptors and process creation API calls. |
| RPC Checks | This test checks for incorrect RPC usage. This test applies only to Windows Server 2003. You'll probably never need to turn this test on. |
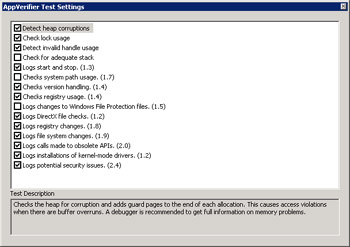
Figure 17-5: AppVerifier Test Settings dialog box
Turning on the AppVerifier add-in for your application is as simple as clicking the Enable Verification button. As you'll notice, you'll need to define your tests and options before you click Enable Verification because the Tests and Options buttons are disabled after clicking it. ACT does come with a demo program, but what it does isn't clear and it doesn't come with source code, so I wrote a quick demo program, AppVerifierDemo, that you can use to see many of the errors that the AppVerifier add-in catches. Simply open the AppVerifierDemo project (which is included with this book's sample files) to see the errors in action. Some of the buttons don't cause errors—for example, the double critical section initialization. ACT 2.6 documented the error but doesn't actually generate it. The important section to play with is the PageHeap Errors section so that you can see how excellent PageHeap is at detecting those tough overruns and other nasty memory errors.
After you've executed your application a time or two, you can look at the logs of the runs and the output saved by the AppVerifier add-in. Although most of the errors the AppVerifier add-in detects result in an immediate access violation, some, such as obsolete function calls, appear only in the log, which you can access by clicking the Log Files button on the Debug toolbar. When looking at the logs, make sure to set the view option to Show All so that you'll see everything.
|
EAN: 2147483647
Pages: 177