Instructions You Need to Know
There are many different instructions on Intel CPUs; the Intel Instruction Set Reference chapter for the Pentium Pro is 467 pages. That doesn't mean there are 467 instructions; it means that it takes 467 pages to describe what the instructions do. Fortunately, many of the instructions aren't used in user-mode programs, so you don't need to be concerned with them. I'll cover only the instructions that are frequently used and the situations in which you'll commonly need them. The format I'll use is to describe a couple of instructions and then demonstrate scenarios in which they apply.
Stack Manipulation
PUSH Push a word or a double word onto the stack
POP Pop a value from the stack
Intel CPUs use the stack extensively. Other CPUs, which have many more registers, might pass parameters to functions in the registers, but the Intel CPUs pass most parameters on the stack. The stack starts in high memory and grows downward. Both these instructions implicitly change the ESP register, which reflects the current top of the stack. After a PUSH, the value in the ESP register decreases. After a POP, ESP increases.
You can push registers, memory locations, or hard-coded numbers. Popping an item from the stack usually moves the item into a register. The key characteristic of the CPU stack is that it's a last in, first out (LIFO) data structure; if you push three registers to save their values, you must pop them off in reverse order, as shown here:
void PushPop ( void ) { __asm { // Save the values in EAX, ECX, and EDX. PUSH EAX PUSH ECX PUSH EDX // Do some operation here that might destroy the values in each // of those registers. // Restore the previously saved registers. Notice that they are // removed from the stack in LIFO order. POP EDX POP ECX POP EAX } } |
Even though there are far more efficient ways of exchanging values, the PUSH and POP instructions allow you to swap register values. The swap happens when you reverse the order of the POP instructions.
void SwapRegistersWithPushAndPop ( void ) { __asm { // Swap the EAX and EBX values using the stack. The sequence gives // you an idea of how to make this swap. PUSH EAX PUSH EBX POP EAX POP EBX } } |
PUSHAD Push all general-purpose registers
POPAD Pop all general-purpose registers
Occasionally when you're debugging through system code, you'll run into these two instructions. Instead of having long chains of PUSH instructions to save all general registers followed later by an equally long set of POP instructions to retrieve all general registers, the Intel CPU offers these two instructions to save and retrieve the registers for you.
Very Common Simple Instructions
MOV Move
The MOV instruction is the most common instruction used on the CPU because it's the way to move values from one place to another. I just showed you how to swap two registers by using only PUSH and POP; now I'll show you how to make the same swap with the MOV command.
void SwapRegisters ( void ) { __asm { // The EAX register is a temporary holder. Swap the ECX and // EBX values. MOV EAX , ECX MOV ECX , EBX MOV EBX , EAX } } |
SUB Subtract
The SUB instruction is the subtract operation. It subtracts the source operand from the destination operand and stores the result in the destination operand.
ADD Add
The ADD instruction adds the source operand to the destination operand and stores the result in the destination operand.
INT 3 Breakpoint
INT 3 is the breakpoint instruction for Intel CPUs. Microsoft compilers use this instruction as padding between functions in a file. The padding keeps Portable Executable (PE) sections aligned based on the linker's /ALIGN switch, which defaults to 4 KB.
LEAVE High-level procedure exit
The LEAVE instruction restores the CPU state when leaving a function. I'll go into more detail about LEAVE in the following section.
Common Sequence: Function Entry and Exit
The majority of the functions in Windows and in your program set up and leave functions in the same manner. The setup is called the prolog, and the leaving is called the epilog; the compiler generates both automatically. When setting up the prolog, the code is setting up to access the function's local variables and parameters. The access is called a stack frame. Although the x86 CPU doesn't explicitly specify any stack frame scheme, the design of the CPU and some instructions make it easiest for operating systems to use the EBP register to hold the pointer to the stack frame.
__asm { // Standard prolog setup PUSH EBP // Save the stack frame register. MOV EBP , ESP // Set the local function stack frame to ESP. SUB ESP , 20h // Make room on the stack for 0x20 bytes of // local variables. The SUB instruction appears // only if the function has local variables. } |
This sequence is common in both debug and release builds. In some release build functions, however, you might see some instructions interspersed between PUSH and MOV. CPUs with multiple pipelines, such as those in the Pentium family, can decode multiple instructions at a time, so the optimizer will try to set up the instruction stream to take advantage of this capability.
Depending on the optimizations you chose when compiling your code, you can also have functions that don't use EBP as the frame pointer. Those procedures have what is called Frame Pointer Omission (FPO) data. When you look at the disassembly for functions with FPO data, the code in the function looks as if it just starts manipulating data. You'll find out how to identify one of these functions in the following section.
The following common epilog undoes the operations of the prolog and is the one you'll see the most in debug builds. This epilog matches the prolog above.
__asm { // Standard epilog teardown MOV ESP , EBP // Restore the stack value. POP EBP // Restore the saved stack frame register. } |
In release builds, using the LEAVE instruction introduced earlier is faster than using the MOV/POP sequence, so you might see that the epilog will be just a LEAVE instruction. The LEAVE instruction is identical to the MOV/POP sequence. In debug builds, the compilers default to MOV/POP. Interestingly, the x86 CPU has a corresponding ENTER instruction to set up the prolog, but it's slower than the PUSH/MOV/ADD sequence, so the compilers don't use it.
How compilers choose to generate code depends a great deal on whether your program is optimized for speed or for size. If you optimize for size, as I strongly recommend in Chapter 2, many of your functions will use more standard stack frames. Optimizing for speed leads to the more convoluted FPO generation.
Variable Access: Global Variables, Parameters, and Local Variables
Now let's turn to accessing variables. Global variables are the easiest to access because they're just a memory reference with a fixed address. If you have symbols for the particular module at the address, you might get to see the name of the global variable. The following example shows how to access a global variable through the inline assembler. With the inline assembler, you can use your variables as either the source or the destination, depending on the instruction, just as you would in straight C programming. In comments below the code, I note what the Disassembly window can show for the operation depending on whether symbols are loaded.
int g_iVal = 0 ; void AccessGlobalMemory ( void ) { __asm { // Set the global variable to 48,059. MOV g_iVal , 0BBBBh // If symbols are loaded, the Disassembly window will show // MOV DWORD PTR [g_iVal (00403060)],0BBBBh. // If symbols are not loaded, the Disassembly window will show // MOV DWORD PTR [00403060],0BBBBh. } } |
If a function has standard stack frames, parameters are positive offsets from the EBP register. If you don't change EBP for the life of the function, parameters appear at the same positive offsets because you push the parameters on the stack before you call the procedure. The following code shows parameter access.
void AccessParameter ( int iParam ) { __asm { // Move the iParam value into EAX. MOV EAX , iParam // If symbols are loaded, the Disassembly window will show // MOV EAX,DWORD PTR [iParam]. // If symbols are not loaded, the Disassembly window will show // MOV EAX,DWORD PTR [EBP+8]. } } |
If you're debugging through optimized code and you see references that are positive offsets from the ESP stack register, you're looking at a function that has FPO data. Because ESP can change throughout the life of the function, you have to work a little harder to keep the parameters straight. When dealing with optimized code, you'll need to keep track of the items pushed onto the stack because a reference to [ESP+20h] can be the same reference as [ESP+8h] earlier in the function. In the process of debugging optimized code, I always take notes about where parameters are located when I'm single-stepping through the assembly language.
If the standard frames are used, local variables are negative offsets from EBP. The SUB instruction reserves the space, as shown in the preceding section "Common Sequence:Function Entry and Exit." The following code shows how to set a local variable to a new value:
void AccessLocalVariable ( void ) { int iLocal ; __asm { // Set the local variable to 23. MOV iLocal , 017h // If symbols are loaded, the Disassembly window will show // MOV DWORD PTR [iLocal],017h. // If symbols are not loaded, the Disassembly window will show // MOV [EBP-4],017h. } } |
If standard frames aren't used, finding local variables can be difficult—if you can find them at all. The problem is that local variables appear as positive offsets from ESP, just as parameters do. The trick in that case is to try to find the SUB instruction so that you can see how many bytes are devoted to local variables. If the ESP offset is larger than the number of bytes set aside for local variables, that offset reference is probably a parameter.
Stack frames are a bit confusing the first time you encounter them, so I think a final example and a couple of illustrations might help clarify the subject. The following code, a very simple C function, will show you why parameters are at positive offsets from EBP and why local variables are at negative offsets with standard stack frames. The disassembly for the function as it was compiled in the ASMer sample program appears after the C function.
void AccessLocalsAndParamsExample ( int * pParam1 , int * pParam2 ) { int iLocal1 = 3 ; int iLocal2 = 0x42 ; iLocal1 = *pParam1 ; iLocal2 = *pParam2 ; } // The AccessLocalsAndParamsExample disassembly with addresses // Standard function prolog 00401097 PUSH EBP 00401098 MOV EBP , ESP 0040109A SUB ESP , 8 // int iLocal1 = 3 ; 0040109D MOV DWORD PTR [EBP-8h] , 3 // int iLocal2 = 0x42 ; 004010A4 MOV DWORD PTR [EBP-4h] , 42h // iLocal1 = *pParam1 ; 004010AB MOV EAX , DWORD PTR [EBP+8h] 004010AE MOV ECX , DWORD PTR [EAX] 004010B0 MOV DWORD PTR [EBP-08h] , ECX // iLocal2 = *pParam2 ; 004010B3 MOV EDX , DWORD PTR [EBP+0Ch] 004010B6 MOV EAX , DWORD PTR [EDX] 004010B8 MOV DWORD PTR [EBP-4h] , EAX // Standard function epilog 004010BB MOV ESP , EBP 004010BD POP EBP 004010BE RET } |
If you set a breakpoint at the start of the AccessLocalsAndParamsExample function, address 0x00401097, you'll see the stack and register values depicted in Figure 6-2.
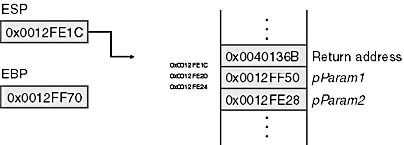
Figure 6-2 Stack before the AccessLocalsAndParamsExample function prolog
The first three assembly-language instructions in AccessLocalsAndParamsExample comprise the function prolog. After the prolog executes, the stack and the base pointer have been set up, the parameters are accessed through positive offsets from EBP, and the local variables are accessible through negative offsets from EBP. Figure 6-3 shows the stack and the base pointer values after each of the prolog instructions executes.
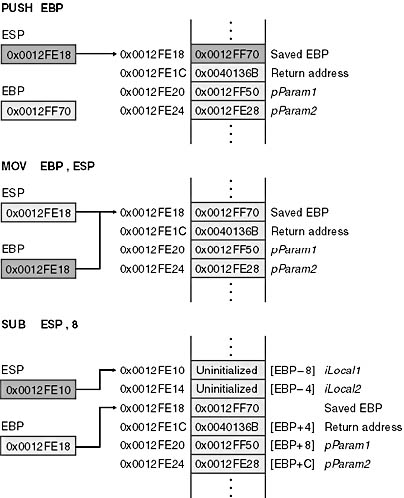
Figure 6-3 Stack during and after execution of the AccessLocalsAndParamsExample function prolog
Calling Procedures and Returning
CALL Call a procedure
RET Return from a procedure
Now that you've seen what procedures look like, I want to show you how to call them and return from them. The CALL instruction is straightforward. When a CALL executes, the CALL implicitly pushes the return address on the stack, so if you stop at the first instruction of the called procedure and look at ESP, the address at the top of the stack is the return address.
The operand to the CALL instruction can be almost anything, and if you browse through the Disassembly window, you'll see calls that go through registers, memory references, parameters, and global offsets. You can use the effective address field of the Registers window to see exactly the procedure you're about to call if the CALL is going through a pointer memory reference.
If you're calling a local function, your call will be a direct call to an address. However, many times you'll see calls that are through pointers, which are generally calls through your import address table (IAT) to imported functions. If the symbols are loaded for the binary you're stepping through, you'll see something like the first CALL instruction shown in the CallSomeFunctions example below. This code indicates that you're calling through the IAT. The "__imp__" is a dead giveaway. The CallSomeFunctions example also shows how to call a local function.
void CallSomeFunctions ( void ) { __asm { // Call the imported function, GetLastError, which takes no // parameters. EAX will hold the return value. This is a // call through the IAT, so it is a call through a pointer. CALL DWORD PTR [GetLastError] // If symbols are loaded, the Disassembly window will show // CALL DWORD PTR [__imp__GetLastError@0 (00402000)]. // If symbols are not loaded, the Disassembly window will show // CALL DWORD PTR [00402000]. //////////////////////////////////////////////////////////////// // Call a function inside this file. CALL NOPFuncOne // If symbols are loaded, the Disassembly window will show // CALL NOPFuncOne (00401000). // If symbols are not loaded, the Disassembly window will show // CALL 00401000. } } |
The RET instruction returns to the caller by using the address that's at the top of the stack, with no checking whatsoever when the instruction is executed. As you can imagine, a corrupt stack can cause you to return anywhere in your application. The RET instruction is sometimes followed by a fixed number. This number specifies how many bytes to pop off the stack to account for parameters pushed on the stack and passed to the function.
EAN: 2147483647
Pages: 122