Mac OS X Server provides a variety of statistics for monitoring the Postfix and Cyrus mail services. Using the Server Admin tool, you can monitor individual mail connections, accounts, and Mail service log files. The information provided by the monitoring tools is invaluable for troubleshooting connection problems and determining if resources are being properly used.
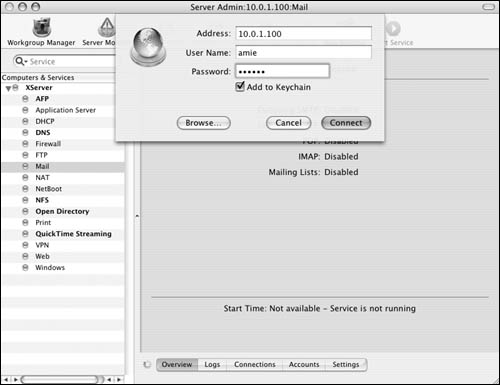
1. | Launch the Server Admin tool located in /Applications/Server, and authenticate as the administrator (Figure 8.63).

|
2. | Select the Mail service for your server in the Computers & Services list.
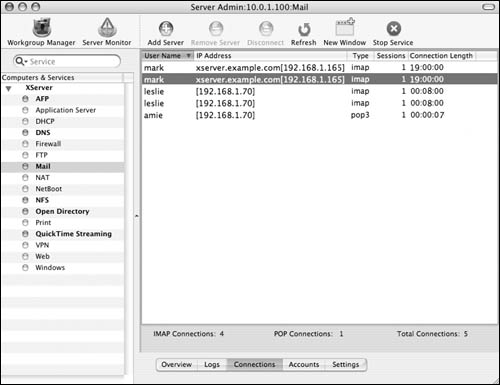
Click the Connections button  to view the current mail client connections (Figure 8.64). In this frame, you can monitor client host addresses, connection types, number of sessions, and connection length. to view the current mail client connections (Figure 8.64). In this frame, you can monitor client host addresses, connection types, number of sessions, and connection length.

|
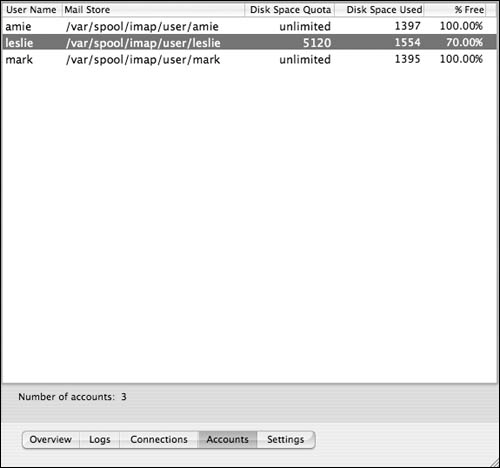
3. | Click the Accounts button  to view users' mail account status. to view users' mail account status.
In this frame, you can monitor user mailbox storage settings and quotas (Figure 8.65).

|
Although the Connections and Accounts charts in Server Admin are convenient, the real business of Mail service monitoring is in the log files. The Postfix and Cyrus mail servers can provide a great deal of information in their log files. You can even modify the log file level to meet your specific needs.
Each protocol has its own log, and the Mailman list service keeps several logs. The location of each log file varies based on the service: the SMTP log file is /var/log/mail.log, the POP and IMAP log file is /var/log/mailaccess.log, and mailing-list logs are located in the /var/mailman/logs/ directory. See the sidebar "Mail Log Analysis Tools" for more information about interpreting Postfix access logs.
1. | Launch the Server Admin tool located in /Applications/Server, and authenticate as the administrator (Figure 8.66).

|
2. | Select the Mail service for your server in the Computers & Services list.
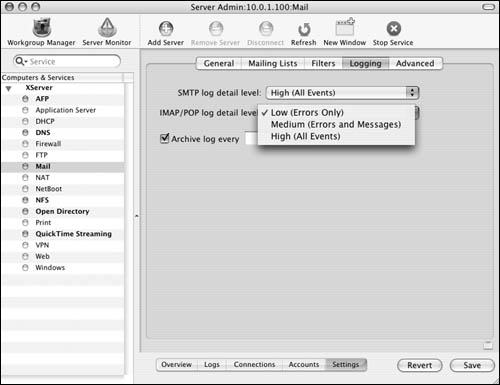
Click the Settings button and  then the Logging tab then the Logging tab  to view the current mail client connections (Figure 8.67). The Logging frame shows settings for both the SMTP and IMAP/POP service logs. to view the current mail client connections (Figure 8.67). The Logging frame shows settings for both the SMTP and IMAP/POP service logs.

|
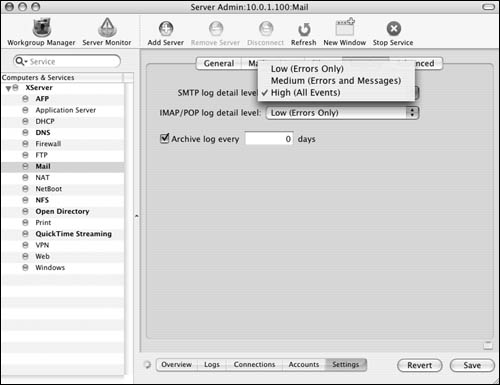
3. | To adjust the log's level of detail, select one of the following values from either pop-up menu (Figure 8.68):
Low Logs only major service errors
Medium Logs all of the Low log's items plus mail messages
High Logs all of the Medium log's items plus any other message or service item

|
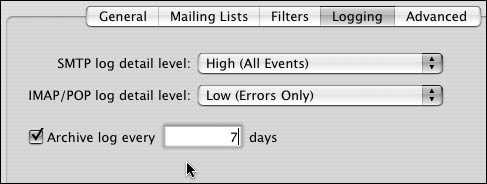
4. | On extremely busy servers, the log files can become large; you may need to archive them to save space. To do so, select the Archive log check box, and enter the number of days between log rotations (Figure 8.69).

|
5. | When you've finished making changes, click the Save button  . .
|
6. | To view the logs, click the Logs button  . .
|
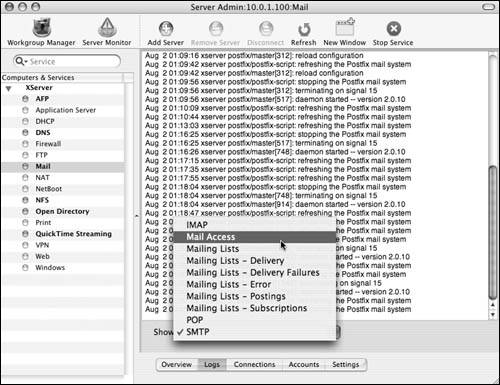
7. | Select the log file you wish to view from the pop-up menu at the bottom of the log window (Figure 8.70).

|

