Built-in Diagnostic and Repair Tools
| < Day Day Up > |
Monitoring Tiger System OperationBeneath the shiny blue Aqua buttons and metallic skin of the Finder, there are dozens of processes and supporting subprocesses that manage your computer. If a problem that affects system operation occurs, chances are there is some sort of audit trail that can lead you to the culprit. In this section, we will look at how you can monitor the inner workings of your operating system and computer from developing a baseline for a properly functioning machine to viewing logs and customizing the configuration of the system logging daemon itself. Creating an Overview of Your System: System ProfilerThe Apple System Profiler (path: /Applications/Utilities/System Profiler) is a tool for browsing the hierarchy of components in your computer, connected to your computer, and installed on your computer. This information can be useful in developing a baseline profile that can be compared against a profile of a "sick" system. To clarify, consider that most computers just "work" or we'd be writing 28 chapters on system troubleshooting and 1 chapter on operation. After a user has configured a working system and is happy with how it operates, a baseline is developed. This baseline includes all the functional parameters for the machine: hardware configuration, software installations, and so forth. If the machine stops working correctly at sometime in the future, it is very likely that something has changed. A comparison of the original baseline to the current configuration can help determine what has changed and give the user an idea of what must be done to fix the problem. System Profiler can create and save full profiles of virtually every system setting in Tiger, giving you the flexibility to analyze working versus nonworking machines without relying on what a user might or might not have installed or changed on the system. System Profiler collects information about your computer when initially launched. Information is divided into four major categories (labeled Contents): Hardware, Software, Network, and Logs. The categories are listed in a pane on the left side of the window. In the initial display, Hardware is highlighted, providing an overview of your system hardware, as shown in Figure 29.8. Figure 29.8. System Profiler collects and displays your system's hardware configuration.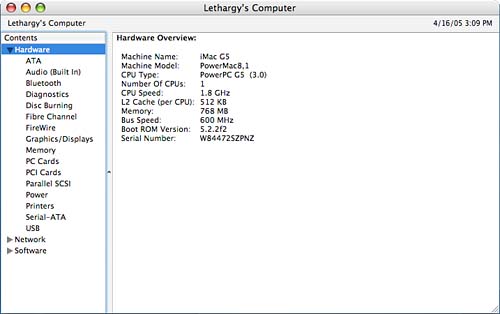 Each of the categories can be expanded or collapsed by clicking the disclosure arrow in front of the topic. Disclosure arrows are used extensively throughout the application, so be sure to click around you'll be surprised at the total amount of available information.
HardwareThe Hardware category, displayed in Figure 29.8, contains a summary of the base computer. By expanding Hardware to show each of the subtopics, you can find everything from the serial and sales order number assigned when your machine was first built to the vendor IDs of devices plugged in to your USB bus. For example, to see the internal disks and ATA (Advanced Technology Attachment) storage devices, click the ATA hardware category. The content area of the screen refreshes with a list of devices at the top and a detail view of the selected device at the bottom. Figure 29.9 shows an example of this screen. Figure 29.9. View details of a given piece of hardware.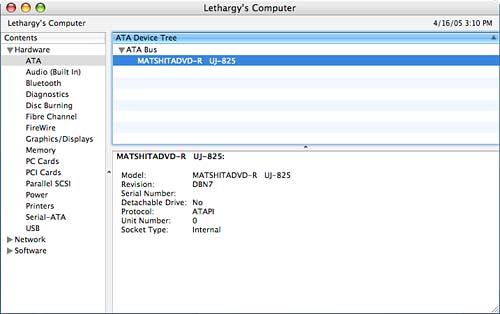 If you're unfamiliar with the standard Macintosh bus types, this list might provide some insight:
SoftwareSelecting the Software profile category displays information about your Tiger system configuration, including version, kernel, boot volume, and active user. You can use the three categories within Software to display extended information about installed components of the operating system.
NetworkThe Network category provides an overview of your installed network configurations, their interface IDs, and IP addresses (if any), as shown in Figure 29.10. Selecting a configuration displays additional information including MAC (Media Access Control) address and subnet mask in the lower details pane. Figure 29.10. The Network category gives you a quick overview of your network status.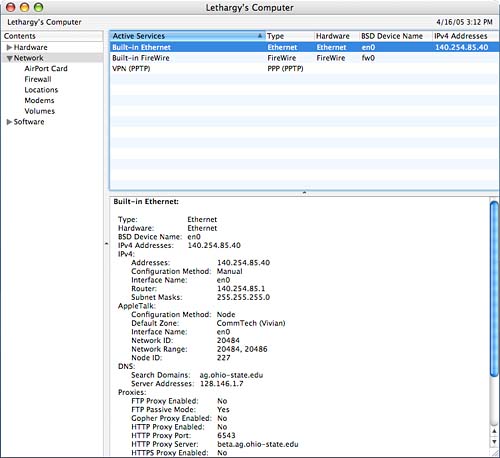 Within the network category are several subcategories for an even greater depth of information:
Exporting System Profiler InformationWhen diagnosing a system problem, it is often useful to have all the configuration information with you. If you aren't sitting in front of the problem computer or need someone else to diagnose a problem remotely, you'll have to get information out of System Profiler and into another machine. To do this, use File, Save As to save in either plain text, RTF, or XML formats. The advantage of an XML-based System Profiler document is that it can be opened on another Tiger system and viewed as if it were the local computer.
Running System Profiler from the Command LineIn the event that you need to perform a remote diagnosis, System Profiler can even be run from the command line with system_profiler. For example, to generate a mini report (rather than a basic report or a full report), I could use system_profiler -detailLevel mini: brezup:jray jray $ system_profiler -detailLevel mini Hardware: Hardware Overview: Machine Name: Power Mac G4 Cube Machine Model: PowerMac5,1 CPU Type: PowerPC G4 (2.9) Number Of CPUs: 1 CPU Speed: 500 MHz L2 Cache (per CPU): 1 MB Memory: 768 MB Bus Speed: 100 MHz Boot ROM Version: 4.1.9f1 ... Likewise I could use the basic or full keyword to generate more verbose output. To limit the display to a certain type of data, the -listDataTypes option can be useful. This option lists all the types of information that can be displayed, which, in turn can be specified on the command line as an option to software_update. For example, SPNetworkDataType is a known data type that displays network information: brezup:jray jray $ system_profiler SPNetworkDataType Network: Internal Modem: Type: PPP (PPPSerial) Hardware: Modem BSD Device Name: modem Has IP Assigned: No IPv4: Configuration Method: PPP IPv6: Configuration Method: Automatic Proxies: Proxy Configuration Method: Manual ExcludeSimpleHostnames: 0 FTP Passive Mode: Yes Auto Discovery Enabled: No ... Finally, you can also export the System Profiler data directly into an XML file compatible with the GUI application by using the -xml option and redirecting the output to a file with the extension .spx: brezup:jray jray $ system_profiler -xml -detailLevel full > systemreport.spx A summary of the system_profiler options and their use is provided in Table 29.6.
Understanding Tiger Logfiles and Apple System LoggerAlmost every server process on your computer generates a logfile. What is logged, and when, is up to the software writing to the log. A centralized process, called syslogd, manages the incoming log data from other applications and directs it to the system console, files, or remote syslogd servers. In previous versions of Mac OS X, syslogd was directly based on the BSD version of the server. In Tiger, syslogd is now known as the Apple System Logger (ASL) and provides support for many additional features that, unfortunately, aren't well documented at this time. Many applications send data to syslog, some to syslog and local logfiles, others only to local files. Apple's goal in introducing ASL is to provide a better logging facility that can be used by Unix applications as well as native Mac OS X programs. We're still a long way from keeping everything in one place. Our first priority will be to get you familiarized with the primary Tiger logfiles as they are initially configured on your computer. Tiger, like other Unix systems, uses /var/log/ as its primary repository for logfiles. Apple has also chosen to create /Library/Logs, and ~/Library/Logs for a handful of other Apple-specific logfiles and /Library/Receipts for logs of installed software.
So, what is stored on your system? Table 29.7 lists the common default Tiger logfiles, their location, and what they contain.
Looking at this list, you might be wondering, "Why are logs for multiple services showing up in a single logfile?" or "Why are multiple logfiles used for a single service?" Remember that many processes log their output via a centralized process called syslog. Messages that are sent to syslog can be stored in multiple locations and directed to different logfiles depending on their level a 32-bit value that contains an encoded facility and level. As you add new Unix software to your computer, you'll find that many applications can and do log via syslog and the only real way to know what is going where is to understand how syslog works, and how you can configure it, which we'll cover in the next section.
Using syslogdThe ASL daemon can be a bit confusing for users coming from other platforms or migrating from earlier versions of the Macintosh. The first point to understand is that syslogd is not generating the messages that are showing up in your logfiles. It provides a logging system that other software can take advantage of, rather than that software having to write its own files similar to the Event Viewer in Microsoft Windows. ASL can redirect incoming log information to remote syslogd servers, the console, logged-in users, and, of course, files providing far more flexibility to developers than if each had to develop logging functions independently. The second point is that syslogd-generated files are often configured to be "message-centric" rather than "application-centric," meaning that logs contain a similar type of message (failed logins, perhaps) from multiple different daemons, rather than multiple messages from a single daemon.
Understanding Facilities and LevelsTo configure syslogd, you first need to understand the vocabulary of the logging system. There are four terms used by syslog, its documentation, and our discussion that you must understand before proceeding:
Levels and facilities are not arbitrary values that the user determines; the syslog daemon defines them. Table 29.8 provides the documentation for the available facilities as found in man 3 syslog.
What facility a program uses to log is determined not by syslogd but by the application itself. You should check the documentation of your software to determine what facilities are used, and how to change them if you want to do so. Note that there are user-level facility names and direct facility names. You'll use the short user-level names when configuring syslogd actions for each facility, but will likely need to use the direct name (which maps to an internal constant) when configuring which facility individual daemons are logging to. Like there are different facilities, there are also a number of predefined levels that can be sent to syslogd with a log message. Levels indicate the nature of the incoming message, and are found in man 3 syslog. Table 29.9 documents the syslogd levels ranked from most to least serious.
Fine-tuning /etc/syslog.confThe syslogd process is configured via /etc/syslog.conf a simple text file that matches selectors (facilities and levels) with an action to perform. A selector is written as <facility>.<level>, where the values are taken from Tables 29.8 and 29.9. An asterisk (*) can be substituted for the facility and/or level to match any facility (except mark) or level.
Actions are can consist of any of the following:
For example, to log all messages logged to the ftp facility at the level of error or higher to the file /var/log/ftperror.log, you would use a line like this: ftp.error /var/log/ftperror.log
If you want multiple selectors to log to the same file, you can use multiple /etc/syslogd.conf lines, or add multiple selectors to a single line by separating them with semicolons. For example, to log all authentication information to the console, you could write: authpriv.*;remoteauth.* /dev/console The asterisk can also be applied to the facility in a selector to select all facilities at a particular level. This can be combined with the none level to exclude certain facilities from the selector. For example, you could use the following line to log all errors except those coming from the mail facility: *.err;mail.none /var/log/allerrorsexceptmail.log A final shortcut is to write multiple facilities that share the same selector as a comma-separated list with only the last facility also containing a level, such as ftp,mail,netinfo.error, which is the same as writing ftp.error;mail.error;netinfo.error. The default Tiger syslogd.conf file should look very similar to this: *.err;kern.*;auth.notice;authpriv,remoteauth.none;mail.crit/dev/console *.notice;*.info;authpriv,remoteauth,ftp.none;kern.debug;mail.crit/var/log/system.log # Send messages normally sent to the console also to the serial port. # To stop messages from being sent out the serial port, comment out this line. #*.err;kern.*;auth.notice;authpriv,remoteauth.none;mail.crit /dev/tty.serial # The authpriv log file should be restricted access; these # messages shouldn't go to terminals or publicly-readable # files. authpriv.*;remoteauth.crit /var/log/secure.log lpr.info /var/log/lpr.log mail.* /var/log/mail.log ftp.* /var/log/ftp.log netinfo.err /var/log/netinfo.log install.* /var/log/install.log local0.* /var/log/ipfw.log *.emerg * As you can see, many of the logfiles mentioned earlier are created via syslog, and the system.log file and console contain selectors that will capture messages from all available facilities. This causes in some of the redundancy you might see when viewing the logs.
Creating a Network syslogd ServerCreating a centralized network ASL server can help get you keep an eye on all your systems without having to directly watch dozens of different machines and files. To do this you must add either -udp_in 1 or -u as an argument to syslogd. This change has to be added directly to the file where syslogd is invoked. In the case of Tiger, this is /System/Library/LaunchDaemons/com.apple.syslogd.plist. The line <string>/usr/sbin/syslogd</string> should be modified to read <string>/usr/sbin/syslogd -udp_in 1</string> Client machines can now be configured to send syslog messages to the centralized server. The default Tiger /etc/syslog.conf could be rewritten to send its logs to a log server at 192.168.0.100 like this: *.err;kern.*;auth.notice;authpriv,remoteauth.none;mail.crit/dev/console *.notice;*.info;authpriv,remoteauth,ftp.none;kern.debug;mail.crit@192.168.0.100 # Send messages normally sent to the console also to the serial port. # To stop messages from being sent out the serial port, comment out this line. #*.err;kern.*;auth.notice;authpriv,remoteauth.none;mail.crit/dev/tty.serial # The authpriv log file should be restricted access; these # messages shouldn't go to terminals or publicly-readable # files. authpriv.*;remoteauth.crit @192.168.0.100 lpr.info @192.168.0.100 mail.* @192.168.0.100 ftp.* @192.168.0.100 netinfo.err @192.168.0.100 install.* @192.168.0.100 local0.* @192.168.0.100 *.emerg * Thankfully, syslog-written logs contain the hostname of the machine generating the message. Logs follow the format: <time stamp> <host generating message> <process name> <log message> This enables an administrator to quickly grep through the contents of a combined logfile for a specific machine's messages. Whether you choose to create a centralized server for a network for simply monitor the activity on your personal computer, a knowledge of syslogd will help make it easier.
Monitoring Console and Log Output: ConsoleThe Tiger GUI hides a tremendous amount of operation information from the user. You've seen that this information is often sent to a number of logfiles. In some cases, however, it is not stored in a file, but sent to a device called the console (/dev/console). On some Unix systems, the console actually is a separate device, such as a VT100 terminal display. On Mac OS X, it exists as a virtual device and is responsible for reporting information as it arrives. The Console application (path: /Applications/Utilities/Console) enables you to watch console-directed error and status messages as they appear. If your computer appears to be stalled or is acting in an unusual manner, Console might be producing information that can help debug the problem. Figure 29.11 shows the Console application. Figure 29.11. The Console application shows internal system error and status messages as they appear.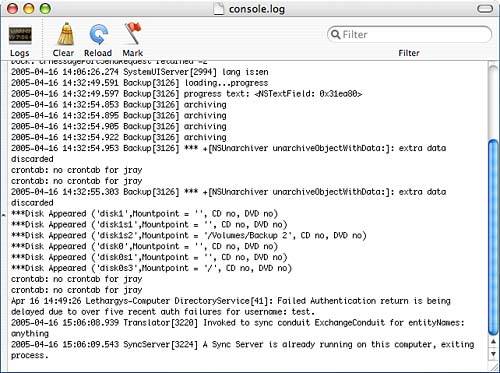 Even on a properly working Tiger system, Console displays error and warning messages related to day-to-day application use. This shouldn't be taken as an indication of a problem, but rather as a demonstration of how closely you can trace your system's operation. Managing the Log ViewTo filter the Log view, use the filter field in the upper-right corner to enter a string that each line must match to be displayed. For example, to display information from the Safari web browser, you would type Safari. To clear the filter, either remove the string or click the X icon at the end of the field. You can also use the toolbar icons to mark the log, which enters a time stamp into the log display, or to clear the display entirely. This does not modify the actual logfiles, just the information display. To reload the full log at any time, click the Reload button, or use File, Reload (Command-R).
Viewing Other LogfilesThe Tiger system maintains a great deal of log information in addition to what is sent directly to the console. Logs are stored in three key locations: your home directory (~/Library/Logs), the system log directory (/Library/Logs), and the BSD log directory (/var/log). The Console application can display the contents of any of the logfiles we've discussed in this chapter (or any other). To view an arbitrary logfile, choose File, Open from the menu, and then drill down through the filesystem until you locate the file you want. An alternative way to locate logfiles is to click the Logs button in the toolbar or choose View, Show Log List from the menu. This opens a pane on the left side of the window with lists of logs in each of the three primary locations, as shown in Figure 29.12. Figure 29.12. Browse other logs on your system.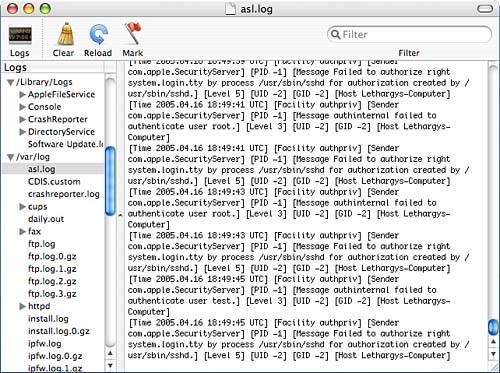 Use the disclosure arrows to browse to the logfile that you want to view, and then select its name to display the file's contents. You can also choose File, Open Quickly to select one of the recognized logfiles for display.
To save a copy of the entire log you are viewing, or a portion of it, choose File, Save a Copy As or File, Save Selection As (Option-Command-S), respectively. Getting Notified When a Log ChangesUse the Console application preferences to set how (and if) you will be notified when a logfile window changes. Click Bounce Icon When Log Is Updated to cause the Dock icon to bounce when there are incoming messages. If you'd prefer to immediately view the log itself, clicking the Bring Updated Log Window to Front check box causes the application to appear and display the new information. The Send Back slider is used to set the length of the delay before the Console application hides itself.
|
| < Day Day Up > |
EAN: 2147483647
Pages: 251