| The IBM pSeries hardware has been known for its RAS capabilities due to IBM's knowledge and experience in developing mainframes and mission-critical servers. Much of the RAS design has been developed to analyze failures within the Central Electronic Complex (CEC) to either eliminate the errors or to contain and reduce them to avoid bringing the entire server down. Some of the RAS features that you see available for Linux on pSeries are: -
Persistent deallocation for memory and processor during boot-time -
Automatic First Failure Data Capture and diagnostics capability -
ECC and chipkill correction in the real memory -
Fault tolerance with N+1 redundancy of power and cooling -
Dual line cords -
Predictive failure analysis and diagnostics -
Robust journaled file system using JFS, reiserfs and others Many of the design efforts put into the development of the pSeries server RAS have been designed to be operating system-independent. This basically means that you do not need the AIX operating systems to exploit most of the RAS capability inside the hardware. In the booting up process, the Built-In Self Test (BIST) and Power-on Self Test (POST) are designed to check the processors, caches, memory prior to loading the operating systems. If a critical error is detected, the system tries to deallocate the component and continue the boot-up process. In this way, your system is not at risk of running with a faulty component. Detected errors are logged into the system non-volatile RAM (NVRAM). Refer to 4.1.2, "IBM diagnostics tools" on page 168 for more information on the nvram. Surveillance of the system operation is provided by the service processor. The service processor basically records and automatically checks for heartbeats from the operating systems. It can be configured to automatically reboot the system if the service processor does not detect any heartbeat within a default time interval. If the system is unable to come up successfully, the service processor logs the error and leaves the system powered on. The service processor is also designed to report errors to the Service Focal Point. In environments where the system is attached to a Hardware Management Console (HMC), the errors are logged and reported to the Service Focal Point application running in the HMC. In additional, the IBM diagnostic tools for Linux on pSeries records and analyzes pSeries-specific messages, and logs them into the Linux system log facility. Generic software and hardware errors are also recorded and analyzed by the Linux error log analysis (LELA). Refer to 4.1.2, "IBM diagnostics tools" on page 168 for the description of the tools packages inside the IBM diagnostics tools. 4.1.1 RunTime abstraction service in PPC64 Specific to the PowerPC kernel, /proc/rtas/* gives you some interface to interact with the service processor directly. The RunTime Abstraction Service or RTAS in Linux is enabled by default by the SuSE Linux Enterprise Server (SLES) 8, or you can recompile the kernel by hand with the CONFIG_PPC_RTAS option. In Figure 4-1, you can see how the RTAS in Linux interacts with the pSeries firmware. Figure 4-1. ppc64 Linux RunTime abstraction service  The open source community is continuously improving RTAS in the PowerPC kernel; here are some of the RTAS service in the /proc file systems that we can use today: -
/proc/ppc64/rtas/progress (read/write) The "progress" file allows you to write the LCD operator panel. For an HMC-attached device, this is shown in the Operator Panel Value. This is very useful for displaying uptime or system performance of that LPAR or server: echo "this is a testing string" > /proc/ppc64/rtas/progress One way to make use of the progress indicator is to display information about the health of the system. The script shown in Example 4-1 basically gets the output from the system load from the uptime command and displays it on the operator panel. Example 4-1. Shell script to echo system load to the pSeries operator panel #!/bin/sh ## Script to echo system load to Operator Panel ## while true do UPTIME="uptime sed 's/^.*verage: //'' echo " " > /proc/ppc64/rtas/progress echo "$UPTIME" > /proc/ppc64/rtas/progress sleep 1 done After you run the script in the background shown in Example 4-1, you notice that the LED operator panel in the HMC displays the uptime as shown in Figure 4-2 on page 167. Figure 4-2. Changing text in the LED panel 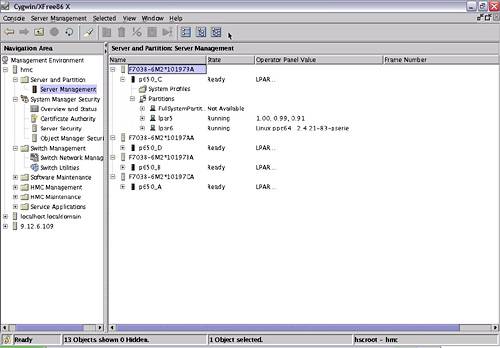 Such a script can be run by the cron daemon based on a certain interval. In this way, the administrator knows about the system load without having to log on to the system to check. -
/proc/ppc64/rtas/clock (read/write) The date command in Linux for pSeries currently only changes the date/time for that particular session. If you need to change the time permanently, you need to update this file. The format of the file is the same as of the command date +%s . # echo "1068155156" > /proc/ppc64/rtas/clock -
/proc/ppc64/rtas/sensors (read) The sensors file allows you to be aware of the hardware operations of the server; the file presents you with a list of the sensors detected in the hardware, and gives you its environmental performance. Example 4-2 on page 168 shows the available sensors detected in a standalone p630 when you run the command cat /proc/ppc64/rtas/sensors . Example 4-2. Sensors for standalone servers RTAS (RunTime Abstraction Services) Sensor Information Sensor Value Condition Location *************************************************************************** Key switch: Normal (read ok) --- Power source: AC (read ok) --- Interrupt queue: Enabled (read ok) --- Surveillance: 0 (read ok) --- Example 4-3 shows sensors of an LPAR in a p650 server. Example 4-3. Sensors for an LPAR server RTAS (RunTime Abstraction Services) Sensor Information Sensor Value Condition Location *************************************************************************** Key switch: Normal (read ok) --- Power source: AC (non existent) --- Interrupt queue: Enabled (read ok) --- The sensors that are available differ from those of servers, and will also be different if you are in LPAR mode. In LPAR mode, most of the hardware monitoring capabilities are done by the Hardware Management Console (HMC). -
/proc/ppc64/rtas/poweron (read/write) The file poweron allows you to set the date and the time to power on the system. This is very useful for a development server that needs to be shut down at night. date -d 'tomorrow 9:00' + %s > /proc/ppc64/rtas/poweron -
/proc/ppc64/rtas/frequency & /proc/rtas/volume (read/write) Frequency and volume allows you to manage the speaker in older RS/6000 hardware. 4.1.2 IBM diagnostics tools IBM has recently released the Linux for pSeries Service aids for hardware diagnostics. The service aids allow system administrators to extract valuable information from the robust pSeries service processor for problem determination and servicing . Many of the commands packaged inside the service aids are very similar to the commands that you may find in AIX. The service aid can be downloaded from the Web site: http://techsupport.services.ibm.com/server/Linux_on_pSeries The IBM diagnostics tools require POWER4-based systems and a supported release of Linux on pSeries (SuSE SLES8 SP3 or Red Hat Advance Server 3). To install the packages, run: # rpm -ivh ppc64-utils-0.4-77.rpm # rpm -ivh lsvpd-0.9.2-1.ppc.rpm # rpm -ivh diagela-1.1.0.1-2.ppc.rpm # rpm -ivh IBMinvscount-2.1-1.ppc.rpm # rpm -ivh devices.chrp.base.ServiceRM-2.1.0.0-2.ppc.rpm Important Be aware that the last RPM in this list (devices.chrp.base.ServiceRM) is dependent on the installation of the five RMC RPMs (src, rsct.core.utils, rsct.core, csm. core , and csm.client). These RPMs are also downloable from: http://techsupport.services.ibm.com/server/Linux_on_pSeries
You need to initialize the lsvpd if you are running it for the first time: # /etc/init.d/lsvpd start Make sure that the lsvpd service is started. This basically creates a symbolic link inside /etc/rc.d/rc3.d and /etc/rc.d/rc5.d: # chkconfig lsvpd 35 # (this will start it at runlevel 3 & 5) After installing the packages, you find the following commands available to extract information from your pSeries server using Linux. These commands are installed into the /usr/sbin/ibmras or /usr/sbin/ directory. Some of these commands require root access. -
nvram This command is used to query and print the data stored in the nvram of the PowerPC-64 system. Example 4-4 shows the output of the nvram command. -
- print-config : prints out all the variables in the open firmware -
- print-vpd : prints out all the VPD -
- print-all-vpd : prints out all the VPD including vendor specific data -
- print-event-scan : displays the event scan log -
- print-err-log : displays error log information Example 4-4. nvram command option to extract event logs p630sles:/ # nvram --print-event-scan Number of Logs: 7 Log Entry 0: flags: 0x00 type: 0x52 Severity: WARNING Disposition: FULLY RECOVERED Extended error type: 3 c6 00 00 08 21 32 58 00 20 03 10 23 00 00 00 00 ....!2X....#.... Log Entry 1: flags: 0x00 type: 0x52 Severity: WARNING Disposition: FULLY RECOVERED Extended error type: 3 c6 00 00 08 22 05 02 00 20 03 10 16 00 00 00 00 ...."........... Log Entry 2: flags: 0x00 type: 0x52 Severity: WARNING Disposition: FULLY RECOVERED Extended error type: 3 c6 00 00 08 23 42 52 00 20 03 10 08 00 00 00 00 ....#BR......... Log Entry 3: flags: 0x00 type: 0x52 Severity: NO ERROR Disposition: FULLY RECOVERED Extended error type: 0 Log Entry 4: flags: 0x00 type: 0x52 Severity: NO ERROR Disposition: FULLY RECOVERED Extended error type: 0 Log Entry 5: flags: 0x00 type: 0x52 Severity: NO ERROR Disposition: FULLY RECOVERED Extended error type: 0 Log Entry 6: flags: 0x00 type: 0x52 Severity: NO ERROR Disposition: FULLY RECOVERED Extended error type: 0number: 19 -
snap The snap command in Linux for pSeries provides functionality that is similar to that of the snap command in AIX. For example, it captures your /var/log/messages, your device-tree inside the /proc file system, /proc tuning, /dev/nvram and your yaboot.conf. It gzips the file for IBM technical support to analyze. -
update_flash This command allows you to update the pSeries firmware directly from Linux. If you are updating the firmware for an LPAR, the respective LPAR requires "service authority" capability. There are cases where you need to download the latest firmware to give your service processor more intelligence and more capability. You can specify it with the option -f and the firmware file that you have just downloaded. Remember to run the checksum (using the command sum ) on the firmware file prior to installation. This ensures that you can download the proper and complete file. Incomplete downloads can be disastrous and could corrupt your server. You can download the latest firmware from the Web site: https ://techsupport.services.ibm.com/server/mdownload While you are updating your firmware, you will see that the operator panel of LPAR will indicate that it is in the process of flashing. Figure 4-3 shows you what you will see after the update_flash command is run. Figure 4-3. Updating of firmware using the update_flash command 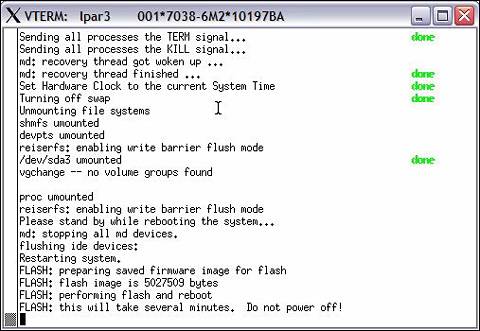 Refer to the IBM Redbook Effective System Management Using the IBM Hardware Management Console for pSeries , SG24-7038, for information on how to set service authority. Corresponding to the above screen, you will notice that the Operator Panel of the LPAR will show as "Flashing". Figure 4-4 on page 172 shows the Operator Panel. Figure 4-4. Operator in HMC showing Firmware Flashing in progress  -
lscfg This command lists all the hardware information that is available in the system. -
- v : prints out in verbose mode -
- vp : prints out in details including vendor specific information The following example shows how to query number of processors: # lscfg -v grep proc p630sles:/usr/src/linux # lscfg -v grep proc proc0 U0.1-P1-C1 Processor proc1 U0.1-P1-C2 Processor~ -
diagela This command is part of the error log analysis tool that provides automatic analysis and notification errors reported by the RunTime Abstraction Service on the pSeries hardware. When an error is detected and corrective actions are required, notification is automatically sent to the Service Focal Point on the Hardware Management Console, or to users specified in the /etc/diagela/mail_list configuration file. At the same time, the logs of the analysis are inside /var/log/messages file. Figure 4-5 shows what is happening at the background of the diagela application. Figure 4-5. Flowchart of the diagela analysis tool in Linux  Whenever the rtas_errd background daemon scans and detects any error reported by the system firmware, it basically activates the analysis program to deduce what kind of problem it is facing . After analysis, it reports it back to the system logs and the respective mechanism that you have configured for it to use. Example 4-5 on page 174 shows the analysis of power failure output from the diagela daemon. Example 4-5. /var/log/messages showing analysis of power failure of the system Diagela for Linux for pSeries Oct 28 14:29:41 lpar1 diagela: 10/28/2003 14:29:40 Oct 28 14:29:41 lpar1 diagela: Automatic Error Log Analysis reports the following: Oct 28 14:29:41 lpar1 diagela: Oct 28 14:29:41 lpar1 diagela: 651204 ANALYZING SYSTEM ERROR LOG Oct 28 14:29:41 lpar1 diagela: A loss of redundancy on input power was detected. Oct 28 14:29:41 lpar1 diagela: Oct 28 14:29:41 lpar1 diagela: Check for the following: Oct 28 14:29:41 lpar1 diagela: 1. Loose or disconnected power source connections. Oct 28 14:29:41 lpar1 diagela: 2. Loss of the power source. Oct 28 14:29:41 lpar1 diagela: 3. For multiple enclosure systems, loose or Oct 28 14:29:41 lpar1 diagela: disconnected power and/or signal connections Oct 28 14:29:41 lpar1 diagela: between enclosures. Oct 28 14:29:41 lpar1 diagela: Oct 28 14:29:41 lpar1 diagela: Supporting data: Oct 28 14:29:41 lpar1 diagela: Ref. Code: 10111520 Oct 28 14:29:41 lpar1 diagela: Oct 28 14:29:41 lpar1 diagela: Analysis of /var/log/platform sequence number: 3 |