Monitoring FileMaker Server
| < Day Day Up > |
| If you administer one or more machines running FileMaker Server, you'll want to take advantage of some of the tools that are available for monitoring resource usage and application events. We look at each of these areas in turn . Working with Usage StatisticsIf you click the Statistics icon in the SAT, you'll see a table of information concerning six key usage parameters on the server. For each parameter, you can see the current, average, low, and peak values. Here's a list of what's monitored .
Working with Application EventsFileMaker Server uses the event-logging facilities of the operating system on which it's installed. On the Windows platform, FileMaker Server events can be viewed with the Windows Event Viewer, whereas on the Mac the events are written to a file called Event.log . Working with Application Events on WindowsOn Windows, you can access the Event Viewer from the left pane of the SAT by choosing Windows Administrative Tools, Event Viewer, FileMaker Server 7. The Event Viewer is shown in Figure 25.18. Figure 25.18. It's a good idea to become familiar with the server event log.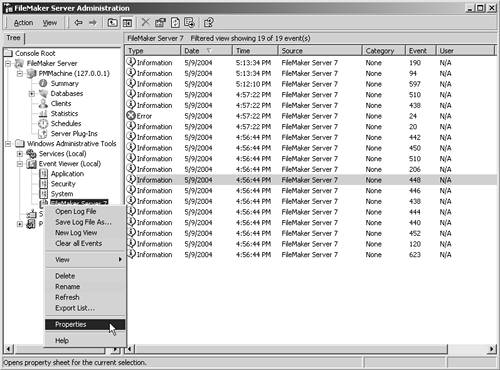 In this view you'll see a list of application events, sortable by any column. Double-clicking an event brings up additional detail about the event. Icons in the left margin indicate events that constitute errors. Right-clicking on the log name enables you to manipulate the log in a variety of ways, such as clearing it or exporting it. Choosing Properties enables you to set some important logging parameters, such as the maximum size of the log and the filtering conditions that govern how the log is displayed. These choices are shown in Figure 25.19. Figure 25.19. On Windows, you can configure a number of useful parameters pertaining to event logging. Working with Application Events on Mac OS XOn the Mac, events are written to the file /Library/FileMaker Server 7/Data/Logs/Event.log . This is a plain text file that you can view with any text editor. You can also view it in the Console application to get a "live" view of the log while the server is running. The Mac OS X event log is shown in Figure 25.20. Figure 25.20. On Mac OS X, the event log is a plain text file.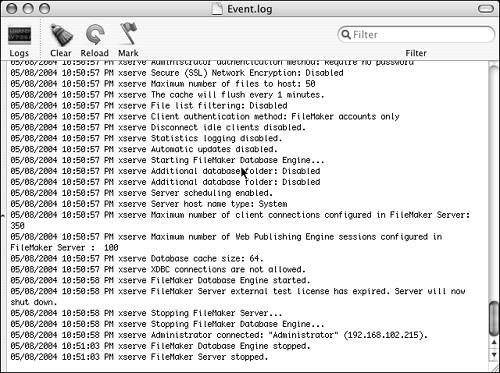 The FileMaker Server event login model is fairly verbose. It logs all current configuration options when it starts up. It logs each database as it opens, and each client connection on a per-client per-file basis. The Event log should always be one of the first sources of information that you draw on when troubleshooting a problem with FileMaker Server. |
| < Day Day Up > |
- ERP Systems Impact on Organizations
- ERP System Acquisition: A Process Model and Results From an Austrian Survey
- The Second Wave ERP Market: An Australian Viewpoint
- The Effects of an Enterprise Resource Planning System (ERP) Implementation on Job Characteristics – A Study using the Hackman and Oldham Job Characteristics Model
- A Hybrid Clustering Technique to Improve Patient Data Quality