Performance Explorer


The intent of the Performance Explorer window is to bring the world of performance profiling and reporting into the IDE. This is done through the concept of performance sessions; these are the primary vehicle, within Visual Studio, for evaluating and analyzing performance issues in code. The process of profiling involves the following actions:

  1. Configuring an application for performance analysis

  2. Collecting the performance data

  3. Viewing/analyzing the collected data

The Performance Explorer provides a point-and-click interface for establishing performance sessions and analyzing the resulting datasets. It has a simple interface with a toolbar and a client area where data is displayed. The Performance Explorer is capable of displaying and managing multiple performance sessions at a time.

Creating a Performance Session

To create performance sessions, you use the Performance Wizard or the New Performance Session buttons (these buttons and others are described in Table 5.11). Clicking the New Performance Session button will create an empty performance session, whereas the Performance Wizard will guide you through setting the various properties of a performance session via a four-page wizard.

Table 5.11. Performance Explorer Toolbar Buttons

Icon

Action

Performance Wizard. Launches the Performance Wizard to create a new performance session.

New Performance Session. Creates a new, empty performance session.

Launch. Runs a performance session against the specific target.

Stop. Stops a currently running performance session.

Attach/Detach. Attaches or detaches a profiler to/from a currently running process. This action is valid and will appear only when the Sampling method is selected in the Method drop-down.

(n/a)

Method. This drop-down allows you to specify the profiling method (either Sampling or Instrumentation) for a performance session.


The Performance Wizard will collect information concerning

  • The type of the assembly you are gathering data about

  • The location of the assembly

  • The method of performance profiling to implement

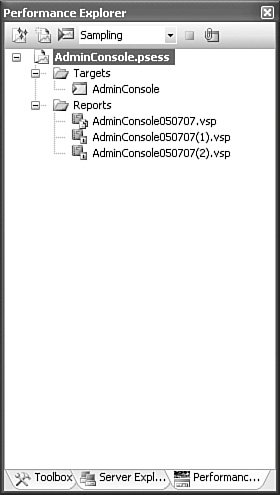
Tip

If a solution is currently loaded into Visual Studio, you can select one of its projects as the target of the performance session instead of browsing to an assembly on disk.


Performance profiling is conducted using either sampling or instrumentation. Sampling is used to profile an entire application; instrumentation is used to specifically target an individual module within an application.

After the basic session information has been collected, the wizard will close and the Performance Explorer will show a tree view of the session data. This tree view is organized into two major parent nodes: Targets (the assemblies or modules you identified in the wizard) and Reports (the actual performance data collected against the targets). Figure 5.11 shows a performance session as viewed within the Performance Explorer.

Figure 5.11. A performance session in the Performance Explorer.


The Performance Explorer can display multiple sessions at one time. The shortcut menu for a session exposes several useful commands including the ability to launch the session, set the session as the current session, and edit the properties for the session.

Configuring a Session

To edit the individual properties of any given session, right-click on the session node (in the example shown in Figure 5.11, this is the node titled AdminConsole.psess), and select the Properties command. The Properties dialog box exposes a variety of basic and advanced properties for the selected session.

General Properties

The General Properties property page enables you to set general instrumentation properties. You can select the profiling method (sampling or instrumentation) and also enable/disable memory profiling during the session.

Two check boxes control the collection of object allocation and lifetime statistics. If the Collect .NET Object Allocation Information box is not checked, the Allocation subreport will not be available for analysis. If the Also Collect .NET Object Lifetime Information box is not checked, the Objects Lifetime subreport will not be available.

You can also control how reports are named and stored:

  • Report Location The physical folder used to save the performance report.

  • Report Name The name of the report.

  • Automatically Add New Reports If checked, will cause new reports to automatically appear under the Reports node within the Performance Explorer.

  • Append Incrementing Number If checked, will cause an incrementing number to be appended to the report name and filename to prevent name collisions.

  • Use a Timestamp If checked, will use a time stamp basis for the report number.

Launch Properties

The Launch Properties page controls the binaries launched and their order. The available binaries appear in a list. Check those to launch in the performance session and use the up and down arrows to change the launch order.

Sampling Properties

Sampling events are the mechanism by which performance sessions collect data at specified intervals during a target run. Use the Sampling Properties page to change the sampling event used by the profiler. You can also change the sampling interval (the time distance between sampling events). For example, you could decide to perform a performance sample after every five page faults. You would configure this by selecting Page Fault as the sample event and changing the sampling interval to 5.

If you select the Performance Counter sample event, you can then select from a list of all of the available performance counters. Figure 5.12 shows an example of sampling based on hardware interrupts. Note that the Summary section (toward the bottom of the dialog box) provides a plain-text description of the selected sampling event and interval.

Figure 5.12. Configuring sample events for a performance session.


Binary Properties

As part of the instrumentation process, probes are automatically inserted into the session targets and assemblies. The Binary Properties property page will override this behavior and force the profiler to first make a copy of the binaries and place them in a specified directory before changing them.

  • Relocate Instrumented Binaries If checked, will cause the target binaries to be copied to a directory before instrumentation. The original binaries will not be touched.

  • Location to Place the Instrumented Binaries Specifies a physical location for the instrumented binaries.

Instrumentation Properties

You use the Instrumentation Properties property page to indicate executables or batch files that you want to run prior to or after a session's instrumentation. You could use this, for example, to make certain environment changes to a machine prior to profiling and then to return the machine to its prior state after profiling has completed.

  • Pre-Instrument Command Line Command to issue prior to instrumentation; this is typically used to specify a .cmd/.bat or executable to run prior to the session instrumentation.

  • Pre-Instrument Description A free-form description of the pre-instrument command.

  • Pre-Instrument Exclude Checking this box will cause the session to skip the pre-instrument command that you have specified (but will not remove it from the text box).

  • Post-Instrument Command Line Command to issue prior to instrumentation; this is typically used to specify a .cmd/.bat or executable to run prior to the session instrumentation.

  • Post-Instrument Description A description of the post-instrument command.

  • Post-Instrument Exclude Checking this box will cause the session to skip the pre-instrument command that you have specified (but will not remove it from the text box).

Advanced Properties

The VSInstr command-line tool is used to instrument and run profiling sessions within the IDE. This takes place behind the scenes when you use the Performance Explorer to create and run those sessions. Sometimes, though, you might need to pass command-line options to the VSInstr tool. The Advanced Properties page is used to do just that.

  • Additional instrumentation options This text box allows you to specify options for the VSInstr command-line tool.

Counters

CPUs generally implement their own performance counters. By checking the box on the Counters property page, you are asking the profiler to collect data directly from one or more of these counters. To select a counter, expand the available counters tree until the counter of interest is shown, highlight the counter, and then click on the arrow button to transfer it to the list of selected counters. Figure 5.13 shows how to select on-chip performance counters.

Figure 5.13. Selecting on-chip performance counters.


Note

The counters available are hardware dependent and will vary by chip type and manufacturer.


Events

.NET applications, and the runtime itself, are capable of registering and exposing a variety of event trace providers. The Performance Explorer can collect data from these providers during a performance session (see Figure 5.14).

Figure 5.14. Collecting data from event trace providers.


Session Targets

Each session can have multiple targets; only one target, however, will be profiled when the session is run. The "launch" target is denoted with a green "run" triangle. Right-clicking on a target will bring up the shortcut menu for targets. From this menu, you can remove the target from the list, set the target as the launch target, or edit the properties of the target. The properties selection will launch an Object Property dialog box in which you can specify more advanced information that is not collected by the Performance Wizard.

Launch Properties

Use the Launch property page to indicate executables or batch files that you want to run prior to or after a session's instrumentations.
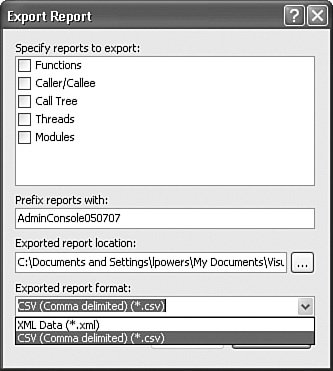
  • Override Project Settings Checking this box enables you to manually specify the target executable and arguments.

  • Executable to Launch The executable assembly to launch as the target of the session.

  • Arguments Arguments to be passed to the target executable.

  • Working Directory The working directory for the target executable.

Instrumentation Properties

The Instrumentation Properties page is identical in form and function to the Instrumentation Properties page in the Session Properties dialog box (discussed previously).

Advanced Properties

This page is identical in form and function to the Advanced Properties page in the Session Properties dialog box (discussed previously).

Reports

The Reports node contains the analysis reports generated as the result of running a profile against a target. Clicking on a report will display its contents in a multitabbed window, similar to a Visual Studio editor window.

Report data can be exported into more consumable formats: Right-click on a report node and select Export Report from the shortcut menu. The Export Report dialog box, shown in Figure 5.15, will launch. When exporting a report, you can you select the desired subreports and the export format (CSV or XML).

Figure 5.15. Exporting a report.


Understanding Performance Reports

The reports generated from a performance session will vary in their form and content depending on whether the session was an instrumentation or sample session. As you can see in Figure 5.15, the profile data is organized across several subreports. With the exception of the Summary, each subreport is displayed in a tabular format with columns and rows; the columns represent the various data collection points (such as Number of Calls or Application Exclusive Time). The rows represent the entities specific to the subreport. For the Functions subreport, for example, these will be functions.

Tip

You can sort a specific subreport by clicking on a column heading. This will toggle between an ascending or descending sort on that column's data. This capability is obviously very useful on reports such as the Functions report: You can sort descending by the Number of Calls column to get a great sense of which routings are being used the most within a given application or module.


Table 5.12 provides an exhaustive list of all of the possible data points within each performance report.

Table 5.12. Performance Report Columns

Column

Subreport

Description

Application Exclusive Time

Functions, Caller/Callee

Execution time for a function that does not include the time for instrumentation, callees from the function, or transition events.

Application Inclusive Time

Functions, Caller/Callee

Same as the Application Exclusive Time sample, except callee times are included.

AVG Application Exclusive Time

Functions, Caller/Callee, Call Tree

The average Application Exclusive Time for all instances of a function within a given time range.

AVG Application Inclusive Time

Functions, Caller/Callee, Call Tree

The average Application Inclusive Time for all instances of a function within a given time range.

AVG Elapsed Exclusive Time

Functions, Caller/Callee, Call Tree

The average Elapsed Exclusive Time for all instances of a function within a given time range.

AVG Elapsed Inclusive Time

Functions, Caller/Callee, Call Tree

The average Elapsed Inclusive Time for all instances of a function within a given time range.

Class Name

Allocation

The name of the class.

Class Token

Allocation, Objects Lifetime

A metadata identifier for a class.

Elapsed Exclusive Time

Functions, Caller/Callee

Time for execution of a function; includes transition events but does not include time for any called functions.

Elapsed Inclusive Time

Functions, Caller/Callee

Time for execution of a function including transition events and execution time for all called functions.

Exclusive Allocations

Functions, Caller/Callee, Call Tree

Object allocations made in a function; excludes all called functions.

Exclusive Allocations %

Functions

Exclusive Allocations expressed as a percentage of all total allocations.

Exclusive Bytes Allocated

Functions, Caller/Callee, Call Tree

Bytes allocated in a function; excludes bytes allocated in any called function.

Exclusive Bytes %

Functions, Caller/Callee, Call Tree

Exclusive Bytes expressed as a percentage of all total bytes allocated.

Exclusive Samples

Functions, Caller/Callee

All samples made in a function; excludes samples in any called function.

Exclusive Transitions

Caller/Callee, Call Tree

Total number of transition events that occurred in a function, excluding any called functions.

Exclusive Transitions %

Functions, Caller/Callee, Call Tree

Inclusive Transitions expressed as a percentage of all total transition events.

Function Address

Functions, Caller/Callee, Call Tree, Allocation

The memory address of a function in hex.

Function Name

Functions, Caller/Callee, Call Tree, Allocation

The name of the function.

Gen 0 Bytes Collected

Objects Lifetime

Total number of bytes collected by the .NET Garbage Collector for a specific generation.

Gen 1 Bytes Collected

Objects Lifetime

Total number of bytes collected by the .NET Garbage Collector for a specific generation.

Gen 2 Bytes Collected

Objects Lifetime

Total number of bytes collected by the .NET Garbage Collector for a specific generation.

Gen 0 Instances Collected

Objects Lifetime

Total number of object instances collected by the .NET Garbage Collector for a specific generation.

Gen 1 Instances Collected

Objects Lifetime

Total number of object instances collected by the .NET Garbage Collector for a specific generation.

Gen 2 Instances Collected

Objects Lifetime

Total number of object instances collected by the .NET Garbage Collector for a specific generation.

Inclusive Allocations

Functions, Caller/Callee, Call Tree

Object allocations made in a function, including all called functions.

Inclusive Allocations %

Functions

Inclusive Allocations expressed as a percentage of all total allocations.

Inclusive Bytes Allocated

Functions, Caller/Callee, Call Tree

Bytes allocated in a function, including all bytes allocated in all called functions.

Inclusive Bytes %

Functions, Caller/Callee, Call Tree

Inclusive Bytes expressed as a percentage of all total bytes allocated.

Inclusive Samples

Functions, Caller/Calle

All samples made in a function, including all samples made in all called functions.

Inclusive Transitions

Caller/Callee, Call Tree

Count of transition events occurring in a function, including all transition events occurring in all called functions.

Inclusive Transitions %

Caller/Callee, Call Tree

Inclusive Transitions expressed as a percentage of all total transition events.

Instances

Allocation, Objects Lifetime

Total number of instances for a given object.

Instances Alive at End

Objects Lifetime

Total number of instances of a given object still alive (loaded in memory) at the time when the performance session ended.

Large Object Heap Bytes Collected

Objects Lifetime

Total number of large object instance bytes, placed on the heap, that were collected by the .NET Garbage Collector.

Large Object Heap Instances Collected

Objects Lifetime

Total number of large object instances, placed on the heap, that were collected by the .NET Garbage Collector.

Line Number

Functions, Caller/Callee, Call Tree, Allocation

The starting line number of a function (within the context of a source file).

MAX Application Exclusive Time

Functions, Caller/Callee, Call Tree

The largest Application Exclusive Time recorded during the performance session for all instances of a function.

MAX Application Inclusive Time

Functions, Caller/Callee, Call Tree

The largest Application Inclusive Time recorded during the performance session for all instances of a function.

MAX Elapsed Inclusive Time

Functions, Caller/Callee, Call Tree

The largest Elapsed Inclusive Time recorded during the performance session for all instances of a function.

MAX Elapsed Exclusive Time

Functions, Caller/Callee, Call Tree

The largest Elapsed Exclusive Time recorded during the performance session for all instances of a function.

MIN Application Exclusive Time

Functions, Caller/Callee, Call Tree

The smallest Application Exclusive Time recorded during the performance session for all instances of a function.

MIN Application Inclusive Time

Functions, Caller/Callee, Call Tree

The smallest Application Inclusive Time recorded during the performance session for all instances of a function.

MIN Elapsed Inclusive Time

Functions, Caller/Callee, Call Tree

The smallest Application Inclusive Time recorded during the performance session for all instances of a function.

MIN Elapsed Exclusive Time

Functions, Caller/Callee, Call Tree

The smallest Application Exclusive Time recorded during the performance session for all instances of a function.

Module Identifier

Functions, Caller/Callee, Call Tree

Within a process, a sequential number assigned to modules as they are loaded.

Module Name

Functions, Caller/Callee, Call Tree, Allocation

The name of the module.

Module Path

Functions, Caller/Callee, Call Tree, Allocation

Physical path to the module.

Number of Calls

Functions, Caller/Callee, Call Tree

Number of calls made to a function.

Parent Function Address

Call Tree

Address in memory of the caller function (in hex).

Percentage of Calls

Functions, Caller/Callee, Call Tree

Number of calls made to a function as a percentage of all calls made to all functions.

Process ID

Functions, Caller/Callee, Call Tree, Allocation, Objects Lifetime

Numeric ID for a given process.

Process Name

Functions, Caller/Callee, Call Tree, Allocation, Objects Lifetime

The name of the process.

Root Application Exclusive Time

Caller/Callee

The Application Exclusive Time for the root function of the selected function.

Root Application Inclusive Time

Caller/Callee

The Application Inclusive Time for the root function of the selected function.

Root Elapsed Exclusive Time

Caller/Callee

The Elapsed Exclusive Time for the root function of the selected function.

Root Elapsed Inclusive Time

Caller/Callee

The Elapsed Inclusive Time for the root function of the selected function.

Root Node Recursive

Functions, Caller/Callee, Call Tree

For a given function, indicates if it was called directly or indirectly in the recursive chain.

Source File Name

Functions, Caller/Callee, Call Tree, Allocation

Source file that contains the given function.

Time Exclusive CAP Overhead

Functions, Caller/Callee, Call Tree

The total time for all probes within the exclusive time of the function that were called by the parent function.

Time Inclusive CAP Overhead

Functions, Caller/Callee, Call Tree

The total time for all probes within the inclusive time of the function that were called by the parent function.

Total Bytes Allocated

Allocation, Objects lifetime

For a given data type or class instance, total number of bytes allocated.

Type

Caller/Callee, Allocation

A number indicating caller/callee relationship: 0Root function 1Calling function 2Called function

Unique ID

Functions, Caller/Callee, Call Tree

A number, in hex, used to identify a function.

Unique Process ID

Functions, Caller/Callee, Tree, Allocation, Objects Lifetime

A sequential number (unsigned integer) assigned to a process in order of its activation.

% Application Exclusive Time

Functions, Caller/Callee, Call Tree

Application Exclusive Time for a given function expressed as a percentage of the sum of all function application exclusive times.

% Application Inclusive Time

Functions, Caller/Callee, Call Tree

Application Inclusive Time for a given function expressed as a percentage of the sum of all function application inclusive times.

% Elapsed Exclusive Time

Functions, Caller/Callee, Call Tree

Elapsed Exclusive Time for a given function expressed as a percentage of the sum of all function elapsed exclusive times.

% Elapsed Inclusive Time

Functions, Caller/Callee, Call Tree

Elapsed Inclusive Time for a given function expressed as a percentage of the sum of all function elapsed inclusive times.

% of Total Bytes

Allocation, Objects Lifetime

A measure of the Total Bytes Allocated divided by the total bytes allocated for all data types or class instances during the performance session.

% Time Exclusive CAP Overhead

Functions, Caller/Callee, Call Tree

The Time Exclusive CAP Overhead expressed as a percentage of the sum of all exclusive CAP overhead timings.

% Time Inclusive CAP Overhead

Functions, Caller/Callee, Call Tree

The Time Inclusive CAP Overhead expressed as a percentage of the sum of all inclusive CAP overhead timings.


There are a total of six subreports (also referred to as views) within a performance report. Each subreport has a small set of data points displayed by default. You can add or remove data points (effectively, adding or removing columns in the subreport) by right-clicking in the report (or on any of the column headers) and selecting Add/Remove Columns. A list of all valid data points for the current subreport will display, enabling you to simply check the ones you want to view. Refer to Table 5.12.

Summary Subreport

The Summary subreport provides a summary of function statistics such as most-called functions, longest-running functions, and so on. Double-clicking on one of the listed functions will jump immediately to the function data in the Functions subreport (see the following section).

This tab is most useful in gaining an at-a-glance feel for performance hot spots within the profiled application or module.

Functions Subreport

The Functions subreport provides an exhaustive list of all functions that were called during the profile session. Each function is presented with timing data and, in the case of an instrumentation session, the number of calls made into that function.

Caller/Callee Subreport

The Caller/Callee tab presents caller/callee information in three separate panes. The middle pane will contain a selected, called function. Functions that appear in the top pane are functions that called the selected function (the caller function), and functions that appear in the bottom pane are functions that were called by the target function (the callee function).

This view is fully dynamic: Clicking on any of the functions that appear in any of the three panes will cause that function to be selected and thus placed in the middle pane, with the caller and callee panes changing to reflect the new selected function.

Call Tree Subreport

The Call Tree view shows you a trace of the call tree generated during the performance session. Each function call is represented within the call tree, and you can expand or collapse lists of called functions within a given root function.

You can reposition any calling function into the root node by using the right-click shortcut menu and selecting Set Root. You can redisplay the true root node by selecting Reset Root from the shortcut menu.

This view is particularly useful to gain insight into inclusive/exclusive function timings.

Allocation Subreport

The Allocation subreport is a list of the types/objects allocated during the performance session. Each type is displayed along with the function or functions responsible for its allocation.

The default columns within this view can be used to identify any types or function areas that are memory intensive.

Objects Lifetime Subreport

The Objects Lifetime view is similar to the Allocation view but instead focuses on the timed lifetime of all types/objects allocated during the session. Each class is represented as a row in the subreport.

Note

Although a large number of data points are useful when analyzing performance, two stand out as great trip-wires for finding code that isn't behaving as expected: Number of Calls and Elapsed Exclusive Time. If a function is looping more than expected or is taking longer to execute than expected, these two data points (both present by default on the Functions view) should immediately help you to identify those routines.


Microsoft Visual Studio 2005 Unleashed
ISBN: 0672328194
EAN: 2147483647
Year: 2006
Pages: 195

flylib.com © 2008-2017.
If you may any questions please contact us: flylib@qtcs.net