Load Testing
| It is important to know how your application handles user load. Typically, you will define a performance benchmark for the application. This benchmark is best represented in terms of the number of users that an application can support at a given time (concurrent users). Without load testing, it is very difficult to know whether you have reached your goal. Clearly, you do not want to wait until after deployment to find out whether you've fallen short of your benchmark. Visual Studio Team Test provides a load testing tool to do just that. With it, you can create a load test. The load test can be configured to simulate multiple users accessing a site concurrently. While the load test runs, you capture instrumentation output from the environment. This data lets you know how the environment and your application held up under stress. Creating a Load TestVisual Studio provides a load test wizard to walk you through the process of creating a load test. The good news is that load tests leverage the web and unit tests you've already defined for the initial stages of application testing. By walking through the wizard steps, you can select the existing tests you will use to simulate load and then configure the actual load. The load test is then added to a testing project where it, too, can be saved, edited, versioned, and run over and again. Let's walk through an example with the New Load Test Wizard. You will simulate load on the customer management application and will leverage the web test created previously. Recall that this test hits most of the pages in the site and is fed from the database. Starting the New Load Test WizardYou launch the New Load Test Wizard by simply adding a load test to a test project. The first screen of the wizard is introductory in nature. Figure 22.30 shows an example. Figure 22.30. The New Load Test Wizard welcome screen. Defining Your Load ScenarioYou define a name for your scenario on the second screen of the New Load Test Wizard. This name is simply a label for the test to help others understand exactly what you want to test. For this example, load test the FindCustomer.aspx, EditCustomer.aspx, and FindOrder.aspx pages. Therefore, call this scenario Find and edit customer, find order. The second screen also allows you to define a think time profile. Think times represent the time a user might spend thinking between requests. This time is used to read the page, fill it out, and so on. Think times are important in that you want to simulate actual users with your load test. You have a few options here. You can use recorded think times. These times were recorded when you created the web test. Therefore, this is a great option. You can smooth out these recorded think times by indicating a standard distribution based on the recorded think times. Last, you can turn think times off altogether. This setting is useful only if you are trying to spike load on the server (and not simulate users). Finally, the second screen allows you to indicate the time between test iterations. This value is in seconds. It is useful if you know something about your users. For example, if you know that approximately every 5 seconds a user initiates a find-and-edit customer process, you could indicate that number here. Figure 22.31 shows the sample setup for the scenario. Figure 22.31. Defining the scenario using the New Load Test Wizard.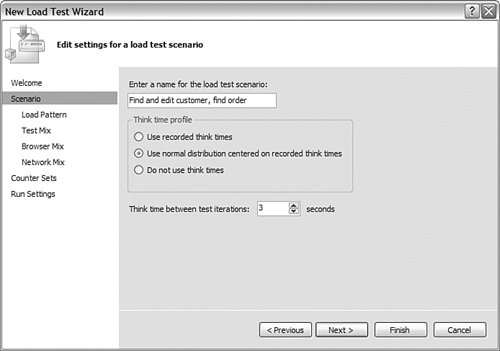 Defining a Load Pattern for Your TestThe next wizard screen is used to indicate a pattern for the load test. You have a couple of options here: constant load and stepped load. The first allows you to execute the test with a steady, constant load of users. For standard load testing scenarios, this is sufficient. You already have think times for the users. If you want to test how the system performs with a constant, target load, you would use this setting. Stepping the load represents a different twist on the load test. For example, you might be trying to determine how the system behaves as more and more users are added to the load. This capability is great if you are testing for a breaking point or bottleneck relative to server and application stress. To define your stepped load, you indicate a starting number of users and a maximum number of users to be stepped up to. You then indicate the time period (duration) between each jump (or step) and the size of each step. Figure 22.32 shows an example of a stepped load. Figure 22.32. Defining the load pattern using the New Load Test Wizard.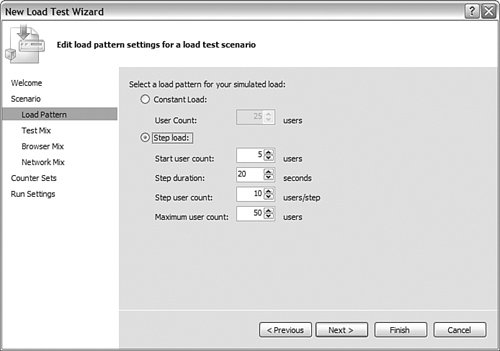 Choosing Tests to Simulate LoadOn the next screen of the wizard, you choose the tests to run to simulate the user load. You can add multiple web tests and unit tests based on your scenario. You can then choose the percentage distribution of each test relative to the overall load test. For example, suppose you have a web test to simulate editing customers and another for looking up their orders. You might also know that for every five customer edits, users do an order lookup. In this case, you can distribute these two tests across your load test. The customer web test would represent 80% of the load, and the order web test would be the other 20%. The example shows one web test created for simulating load. Figure 22.33 shows an example of the Test Mix screen. Figure 22.33. Defining tests using the New Load Test Wizard.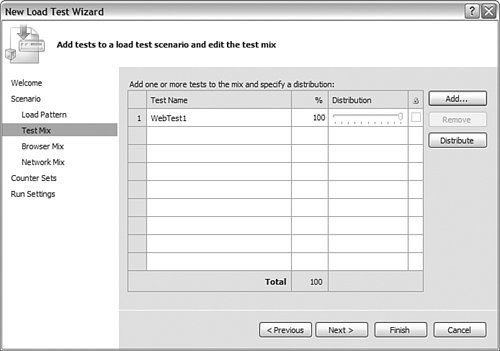 Note Remember to set your web test data source to pull data randomly or sequentially. If you use the Unique setting, then each row will be pulled from the database and the load test will report an error, indicating there was insufficient data to finish the test. Indicating a Browser MixThe fifth screen of the load test allows you to simulate the browsers that users might use to visit your application. Again, you can distribute these browsers across a percentage. Figure 22.34 shows an example. Figure 22.34. Defining the browser mix using the New Load Test Wizard.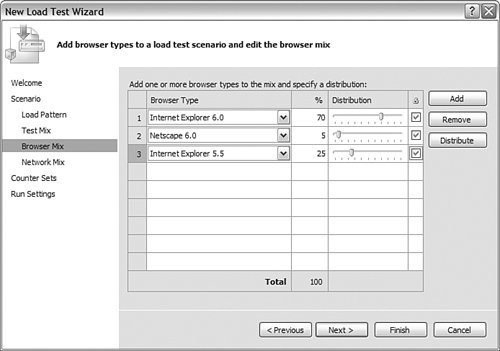 Indicating a Network MixNext, you indicate the user's network mix. If you know that 100% of the users are on the LAN, then you can indicate that information here. If, however, a portion of the user base comes from outside the LAN, you can set up that distribution on this page. Of course, setting up the distribution this way requires you to have some data about your user base (or do projections). Figure 22.35 shows an example of this screen. Figure 22.35. Defining the network mix using the New Load Test Wizard.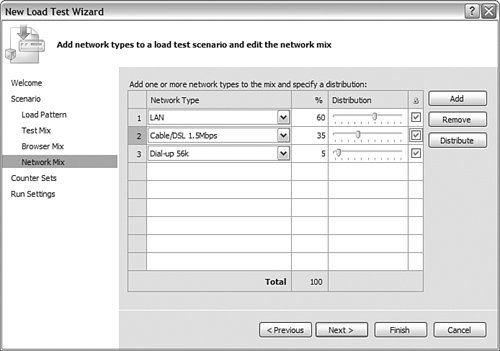 Choosing Computers to MonitorThe next screen in the wizard is used to determine which servers the load test should monitor. If your application is distributed on multiple servers, you would indicate the details of these computers here. You also want to indicate the controller computer. This is the computer running the tests. Of course, for best results you will want the controller computer and the server computers to be physically different machines. In addition, for each computer you intend to monitor, you can define a counter set. A counter set represents a standard set of performance indicators you want to monitor. There are counter sets for IIS, SQL, and so on. Figure 22.36 shows an example of the Counter Sets screen. Figure 22.36. Defining counters using the New Load Test Wizard.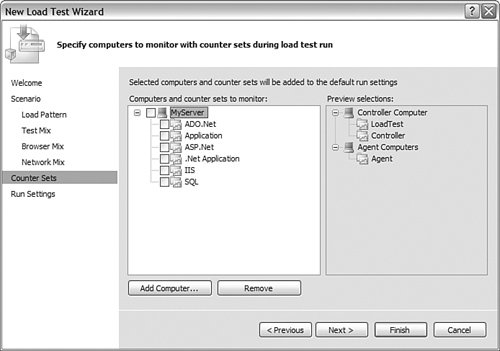 Indicating Execution Timings and Run SettingsThe final screen of the wizard is used to define configuration settings for the load test. These settings include the timings, the number of errors to trap, and the validation level. Recall the validation level from the web tests; this is the level of validations to run to simulate load. If, for example, you define a number of validations for your web test, these validations take away from performance and have nothing to do with simulating actual users. Therefore, you can indicate a level here that excludes these validations. Figure 22.37 shows an example of this final screen in the wizard. Figure 22.37. Configuring run settings using the New Load Test Wizard.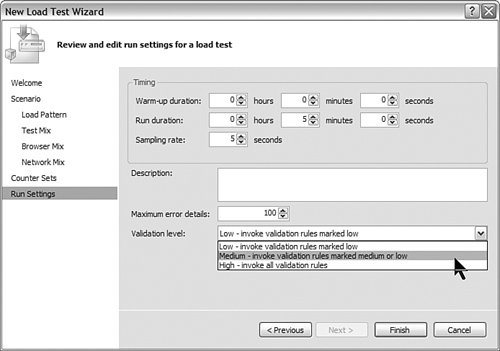 Reviewing and Editing a Load TestWhen the wizard finishes, it creates a .loadtest file. This file can be opened and edited within the IDE. Figure 22.38 shows an example of the file open in the IDE. Notice that each section defined in the wizard is represented here. Figure 22.38. The load test viewer.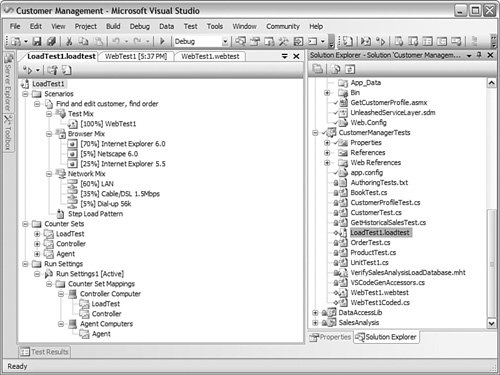 If you need to edit an item, you can select it and modify its settings through the Properties window. You can also right-click a section and bring up an editor. For example, if you want to change the Network mix, you can right-click this section and choose Edit Network Mix to bring up a dialog box that looks just like the wizard page for this setting. Running Load Tests and Reviewing ResultsYou are finally ready to run the load test. When you click the Run button on the load test page (refer to Figure 22.38), Visual Studio opens the load test monitor window. This window is shown in Figure 22.39. Figure 22.39. Monitoring a load test.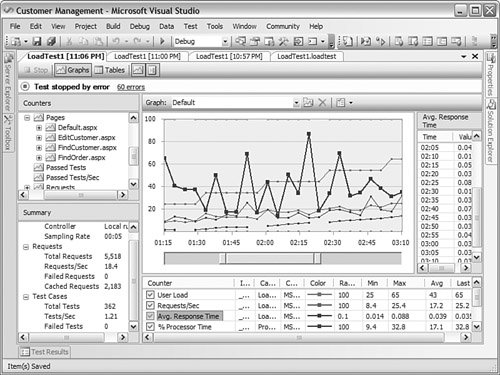 If you have used the Performance Monitor in Windows, you will find similarities with this screen. At the center of the monitor is a graph that tracks the counters over time. The counters being tracked are listed at the bottom of the screen, along with their general statistics. It is helpful to select one of these counters to see the line of the graph highlighted. Notice that the figure focuses on the Average Response Time for the duration of 1:45 to 2:30. You can also see in the counter window the average response time and the minimum and maximum times. Everything here responds in less than a second (0.088 max). There are a couple of other windows here. The Counters window to the left allows you to navigate counters and add them to the monitor. The Summary window shows a summary view of the tests. You can locate some key statistics in this window, such as the total requests, requests per second, use of the cache, and so on. Last, when the load test stops running, the data is stored. You can work with this data and review it in detail. In addition, you can look for trends and breaking points. You can also review errors that occurred during execution. In the example, there were 60 errors. However, these errors were all the result of a bad counter that could not be found. |
EAN: 2147483647
Pages: 195