Performance Monitors
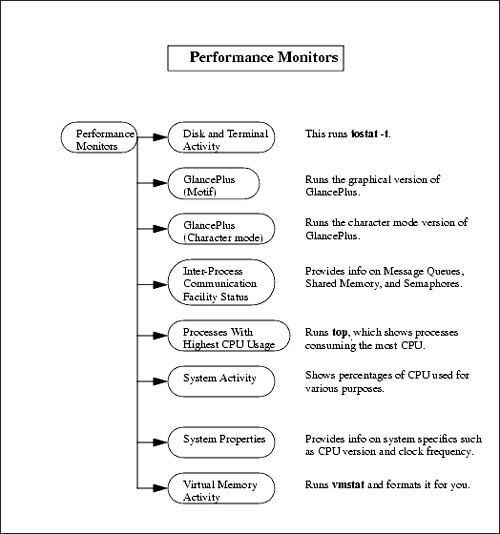
Performance MonitorsUnder Performance Monitors, you can view the performance of your system in several different areas such as disk and virtual memory. Figure 10-32 shows the menu hierarchy of Performance Monitors : Figure 10-32. Performance Monitors Menu Structure Performance Monitors provides you with a window into several areas of your system. If you are serious about becoming familiar with the tools available on your system to help you understand how your system resources are being used, you should take a close look at Chapter 11. Chapter 11 is devoted to getting a handle on how your system resources are being used, including many built-in HP-UX commands. Some of the performance monitors you can select in this subarea are HP-UX commands, which you'll need some background in before you can use them. I'll cover these areas only briefly because this material is covered in more detail in Chapter 11. Disk and Terminal Activity
The iostat command gives you an indication of the level of effort the CPU is putting into I/O and the amount of I/O taking place among your disks and terminals. The following example shows the iostat -t command, which will be executed every three seconds, and associated output from an HP-UX 11.x system:
For every terminal you have connected (tty), you see a "tin" and "tout," which represent the number of characters read from your terminal and the number of characters written to your terminal, respectively. The -t option produces this terminal report. For your CPU, you see the percentage of time spent in user mode ("us"), the percentage of time spent running user processes at a low priority called nice ("ni"), the percentage of time spent in system mode ("sy"), and the percentage of time the CPU is idle ("id"). For every locally mounted file system, you receive information on the kilobytes transferred per second ("bps"), number of seeks per second ("sps"), and number of milliseconds per average seek ("msps"). For disks that are NFS-mounted or disks on client nodes of your server, you will not receive a report; iostat reports only on locally mounted file systems. GlancePlusGlancePlus is available here if it is installed on your system. You are given the choice of using either the Motif (graphical) version or the character mode version of GlancePlus. GlancePlus and other HP VantagePoint products are covered in Chapter 11. Inter-Process Communication Facility StatusInter-Process Communication Facility Status shows categories of information related to communication between processes. You receive status on Message Queues, Shared Memory, and Semaphores. This is a status window only, so again, when you press Return , and the window closes . Processes with Highest CPU UsageProcesses with Highest CPU Usage is a useful window that lists the processes consuming the most CPU on your system. Such useful information as the Process ID , its Resident Set Size , and the Percentage of CPU it is consuming are listed. System ActivitySystem Activity provides a report of CPU utilization. You receive the following list:
System PropertiesSystem Properties gives you a great overview of system specifics. Included here are those hard-to-find items such as processor information, CPU version, clock frequency, kernel support (32-bit or 64-bit), memory information, operating system version, and network IP and MAC addresses. Virtual Memory Activity
vmstat provides virtual memory statistics. It provides information on the status of processes, virtual memory, paging activity, faults, and a breakdown of the percentage of CPU time. In the following example, the output was produced ten times at five-second intervals. The first argument to the vmstat command is the interval; the second is the number of times you would like output produced.
You will get more out of the vmstat command than you want. Here is a brief description of the categories of information produced by vmstat : Processes are classified into one of three categories: runnable ("r"), blocked on I/O or short- term resources ("b"), or swapped ("w"). Next you will see information about memory. "avm" is the number of virtual memory pages owned by processes that have run within the last 20 seconds. If this number is roughly the size of physical memory minus your kernel, then you are near paging. The "free" column indicates the number of pages on the system's free list. It doesn't mean that the process has finished running and these pages won't be accessed again; it just means that they have not been accessed recently. Next is paging activity. The first field ( re ) shows the pages that were reclaimed. These pages made it to the free list but were later referenced and had to be salvaged. Check to see that "re" is a low number. If you are reclaiming pages that were thought to be free by the system, then you are wasting valuable time salvaging these. Reclaiming pages is also a symptom that you are short on memory. Next you see the number of faults in three categories: interrupts per second, which usually come from hardware ("in"); system calls per second ("sy"); and context switches per second ("cs"). The final output is CPU usage percentage for user ("us"), system ("sy"), and idle ("id"). This is not as complete as the iostat output, which also shows nice entries. | ||||||||||||||||||||||||||||||||||||||||||||||||||||||||||||||||||||||||||||||||||||||||||||||||||||||||||||||||||||||||||||||||||||||||||||||||||||||||||||||||||||||||||||||||||||||||||||||||||||||||||||||||||||||||||||||||||||||||||||||||||||||||
EAN: 2147483647
Pages: 301