| Code snippets were a popular part of ColdFusion Studio and have been carried over into Dreamweaver MX. Snippets are a way to save small blocks of code so that they are always available to you, and other developers for use. Snippets differ from server behaviors in that they do not present any interface to the designer for values and the like to be filled in. Server behaviors are best suited to common application tasks that may be undertaken by Web designers who are unfamiliar with ColdFusion code and who are unable, and do not want to, interact with CFML tags and script. You can build your own server behaviors, and Appendix B, "Server Behavior Builder" shows you how to, with an example. Snippets are more likely to be used by application developers who do most of their work through hand coding. Snippets expose the developer to the code, and the developer will often perform minor modifications to the snippet to set correct variable names and values, for instance. You could also think of snippets as like library items for code. Unlike library items, they do not automatically update or tie to a particular site. To use snippets, expand the Code panel and select the Snippets tab. In the bottom pane is a series of folders into which snippets are organized. Each folder covers a particular technology or area of functionality. Dreamweaver has some code snippets already built in. These are snippets of HTML and JavaScript to do common client-side tasks. You can add your own snippets for ColdFusion. If you expand a folder and select a code snippet, as we have done in Figure E.11, you will see the selected snippet in the top pane. HTML snippets are usually shown in a design view (showing what the HTML looks like in the browser), whereas JavaScript and other code snippets are shown in code view so that you can see the actual code. Figure E.11. Code Snippets let you reuse code. Some built-in snippets are already available, such as this JavaScript code to disable the right-click menu in the browser.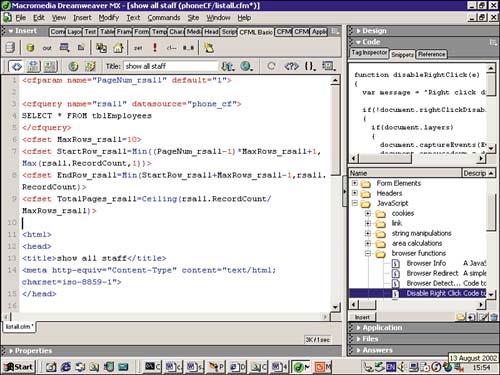
Snippets can either be standalone blocks of code, or they may consist of code that wraps itself around an object. A section of code that redirects a page will probably be a standalone block of code, whereas code that modifies the behavior of a hyperlink will probably wrap itself around a hyperlink object. Using Code Snippets Code snippets are best used in code view. For JavaScript snippets, you will first need to insert the <script> tags. For a standalone block, place the insertion cursor on the page where you want it to go. For a wraparound snippet, select the object you want to wrap the code around. Choose the snippet you want and right-click it (Control+click on the Mac), as shown in Figure E.12. Then choose Insert from the pop-up menu. Figure E.12. Inserting a supplied JavaScript code snippet in your page.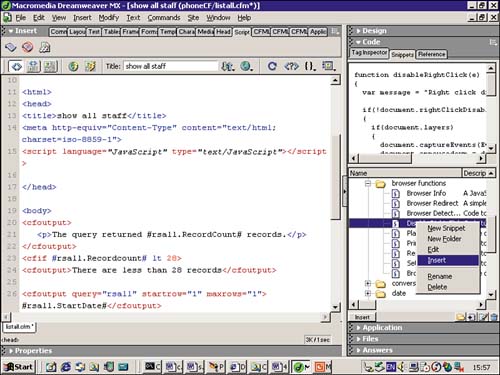
Creating Your Own Code Snippets To create your own snippets you should first create a new folder for your own type of snippets. Right-click (Control+click on the Mac) in the Snippets window and choose new folder. Give the snippet folder a descriptive name, remembering that other developers may well be using these snippets, too. If the folder is created in the "wrong" place, you can drag it to the level you want. Right-click (Control+click on the Mac) on the folder and choose New Snippet from the pop-up menu. Alternatively, you may have already written the snippet code in the page if so, highlight the code you want to use as the snippet and right-click (Control+click on the Mac) to choose Create New Snippet from the pop-up menu. You will then be presented with the Snippet dialog box; fill in the snippet name and description. If you have highlighted existing code, the code box will already be filled in. If you want the code to flow around a selected object, such as an image or table cell, select the Wrap Selection option, specifying which part of the code goes before the object and which after the object. If the code is a standalone block, choose the Insert Block option. The Snippet dialog box is shown in Figure E.13. In this example, a block of CFML is used to display the age in a text input box if the age exists, but if the age field is empty, the words Age Unknown are displayed. Figure E.13. Inserting a snippet, including a description for yourself and other designers.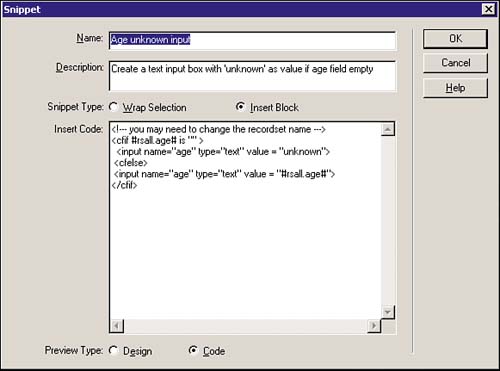
You can also choose whether you see the snippet preview as code (most likely) or in design view. Managing Snippets To edit a snippet that exists, right-click (Control+click on the Mac) the snippet and choose Edit from the drop-down menu. The Snippet dialog box appears, and you can edit the code or change the description. To move snippets into other folders, simply drag them to the folder you want. Snippets are kept in files with the extension CSN. The folder structure of your Snippets panel is reflected in the folder that each file is kept in within the snippets subfolder of the Dreamweaver Configuration folder. This will usually be C:\Program Files\Macromedia\Dreamweaver MX\Configuration\Snippets in Windows, and Hard drive : Applications : Macromedia Dreamweaver MX : Configuration : Snippets, on the Mac. You can exchange these snippet files with other developers in your organization, or even over the Web. Debugging ColdFusion One of the most powerful combinations of Dreamweaver and ColdFusion is the integrated debugger that Dreamweaver provides for ColdFusion pages. This feature is available only for ColdFusion and not for other server technologies. When you use Dreamweaver, debugging information is displayed inside the Dreamweaver environment, allowing you quick access to the code that's causing problems. If you cannot see which part of your code is to blame, Dreamweaver provides a full set of page information to help you trace the problem. The best way to find out about the debugger is to actually use it. We are going to construct a simple ColdFusion page with some deliberate mistakes in them and use the debugger to find, and fix, the errors. NOTE The page is not a demonstration of the best way to code ColdFusion pages; it has been made as simple as possible to highlight features of the debugger.
Integrated debugging works only on Windows machines. On Macs you need to open the page in a separate browser window (Preview in Browser) and view the debugging information provided on that page at the bottom of the page. The first step to take is to enable ColdFusion debugging, in the ColdFusion Administrator. Choose the Start button, Programs, Macromedia ColdFusion MX, Administrator. Internet Explorer starts, taking you to the login page, as shown in Figure E.14. You will have to enter the administrator's password that you set up while installing ColdFusion. Figure E.14. Log in to the ColdFusion Administrator using the password you set during installation.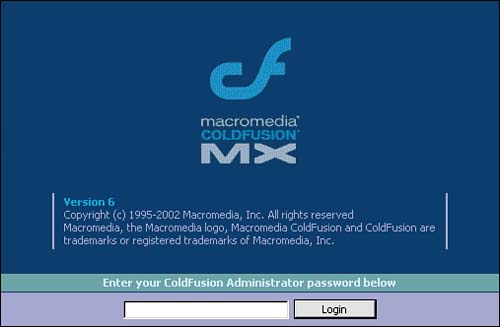
After entering the password, you will go to the ColdFusion Administrator's Home Page. This page is framed; click the Debugging Settings link in the left menu frame. You will be shown the debugging settings page, as you can see in Figure E.15. Select the Enable Debugging check box. All the other settings should be left as they are. When debugging is turned on, your pages will execute more slowly and show additional information in them. After your debugging session, you will probably want to turn debugging off by unchecking the Enable Debugging check box. Figure E.15. The debugging options are set on the Debugging Settings page, selected from the menu frame on the left.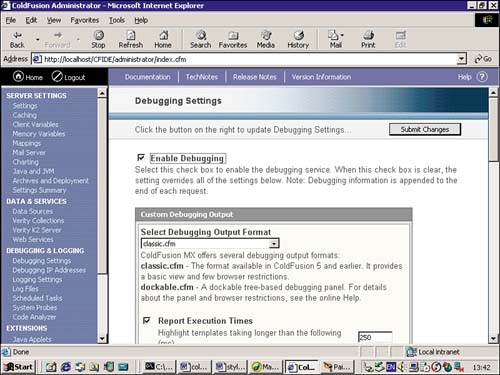
Next, create a page to debug. Listing E.2 is an example of a simple page that could be used for the debugging exercise. It uses the CompanyInfo database that is supplied with ColdFusion as a tutorial. The precise page details are not important. Listing E.2 contains an error in the SQL query the table name is spelled incorrectly the table should be called employee, but is mistakenly called employees, on line 2 of the listing. Listing E.2 Page with a SQL Error to Debug <cfquery name="rsStaff" datasource="CompanyInfo"> SELECT * FROM Employees </cfquery> <html> <head> <title>Debugging ColdFusion</title> <meta http-equiv="Content-Type" content="text/html; charset=iso-8859-1"> </head> <body> <cfoutput> <p>There are #rsStaff.RecordCount# staff members listed </p> </cfoutput> <table width="100%" border="1"> <tr> <th>ID Number</th> <th>First Name</th> <th>Last Name</th> <th>Start Date</th> </tr> <cfoutput query="rsStaff"> <tr> <td>#rsStaff.Emp_ID#</td> <td>#rsStaff.FirstName#</td> <td>#rsStaff.LastName#</td> <cfif year(#rsstaff.StartDate# lt 1995> <td bgcolor="yellow">#rsStaff.StartDate#</td> <cfelse> <td>#rsStaff.StartDate#</td> </cfif> </tr> </cfoutput> </table> </body> </html> Click the Server Debug button on the document toolbar (it looks like a globe and lightning bolt). Dreamweaver will open up the page in an internal Internet Explorer browser window, showing the results of the page. Dreamweaver also opens a Results panel below the page, showing server debug information. If your page has an error in it, as the page in Listing E.2 has, a debugging message will be shown on the page, giving information to help you locate the error. In the Results panel, Dreamweaver shows lots of useful information for tracking down errors. If the page was called from another page for example, a page that handles form results all the pages the server processed to render the page are listed in the template stack folder. If the page has been run directly from Dreamweaver, as our example has, you will not see this folder. Other information shown may include the SQL queries executed on the page, names of the server variables, and their values, if any. The panel also shows a summary of execution times. The results of debugging the file in Listing E.2 are shown in Figure E.16. The page at the top of the screen includes a message to say that the database cannot find a table called "Employees." If you scroll down the Results pane, you will see a folder marked Exceptions. This gives a link to the file that created the error, followed by a line number. Figure E.16. Debugging information is shown on the page displayed in the top pane and in the Results panel below.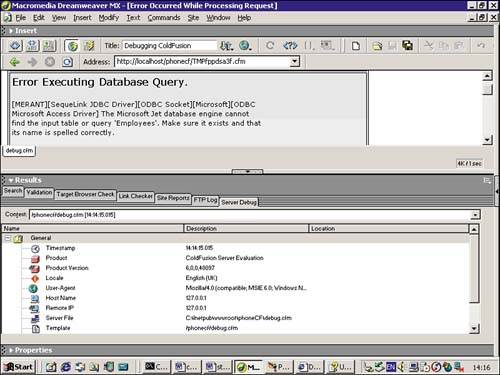
Clicking the link opens the file in code view and moves to that line number. Do not expect that this line will automatically contain the error. Sometimes the error occurs before the indicated line, but is only spotted a few lines further down. If you move up a few lines, you can fix the SQL query to spell the name of the table correctly as "Employee." If you click the Server Debug button again to rerun the file, it should run correctly. Take the opportunity to browse through the Results pane, examining the information shown. The next debugging exercise is to spot a problem in the CFML code. Listing E.3 is almost the same as Listing E.2. The SQL query is now correct, but there is a missing bracket in the <cfif> tag on line 26. Listing E.3 Debugging a CFML Tag <cfquery name="rsStaff" datasource="CompanyInfo"> SELECT * FROM Employees </cfquery> <html> <head> <title>Debugging ColdFusion</title> <meta http-equiv="Content-Type" content="text/html; charset=iso-8859-1"> </head> <body> <cfoutput> <p>There are #rsStaff.RecordCount# staff members listed </p> </cfoutput> <table width="100%" border="1"> <tr> <th>ID Number</th> <th>First Name</th> <th>Last Name</th> <th>Start Date</th> </tr> <cfoutput query="rsStaff"> <tr> <td>#rsStaff.Emp_ID#</td> <td>#rsStaff.FirstName#</td> <td>#rsStaff.LastName#</td> <cfif year(#rsstaff.StartDate# lt 1995 <td bgcolor="yellow">#rsStaff.StartDate#</td> <cfelse> <td>#rsStaff.StartDate#</td> </cfif> </tr> </cfoutput> </table> </body> </html> Again, click the Server Debug button and view the page in the top window and the Results panel below. As you can see from Figure E.17, the Results panel indicates an exception at line 26. Clicking the line opens the page at line 26 in code view. You can carefully study this line and see where the error lies. Correct the error and debug again to check that all is well. Figure E.17. The Results panel tells us where it thinks the error occurred on the page.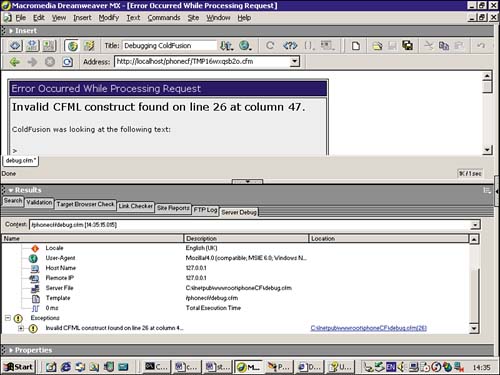
If you are running on a Mac, you do not get this debugging information within Dreamweaver. The debugging information is supplied by the ColdFusion Server (on the page which Windows users see in the top window of the debugging view) in a separate browser window for Macintosh users. This information, although not as well presented or as extensive as that provided in the debugging view, is quite adequate for you to spot errors on the page. | 
