Chapter 24: Working with the W32Dasm Disassembler and Softlce Debugger
| | ||
| | ||
| | ||
In this chapter, I cover my two favorite tools for analyzing programs.
W32Dasm Debugger
The W32Dasm is a symbiosis of a powerful disassembler and a debugger. For the moment, version 8.93 of this program is the most widespread. It can work not only with PE modules but also with DOS, NE, and LE modules. In this chapter, I cover methods of working with this program in as much detail as possible.
Getting Started
The program window is shown in Fig. 24.1. The menu is supplemented by the toolbar whose elements are activated depending on the situation.
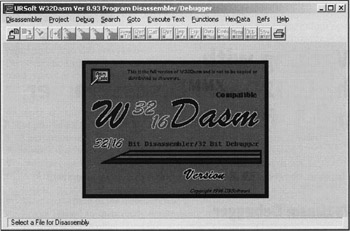
Figure 24.1: W32Dasm window
As already mentioned, this program is a combined disassembler and debugger This is reflected by the presence of two menu items: Disassembler and Debugger . Accordingly, there are individual settings for debugger and disassembler. For disassembler, there are only three options related to the analysis of cross-references in conditional jumps, unconditional jumps , and procedure calls. By default, all three options are set. Disabling these options is undesirable, because it reduces the informative value of the disassembled code. However, you might wish to disable these options when disassembling large programs to speed up the code analysis.
Debugger options are greater in number; however, they all are self-evident. The debugger options window is shown in Fig. 24.2. All these options relate to specific features of loading processes, threads, and dynamic link libraries (DLLs).
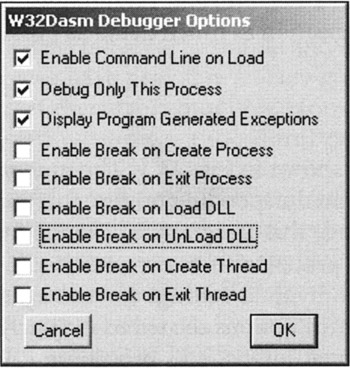
Figure 24.2: Debugger options
To begin working with the executable module, choose the required file from the Disassembler Open File menu. After that, the program will analyze the module and output the disassembled text with comprehensive information about the module's sections. [i] W32Dasm correctly recognizes Application Programming Interface (API) functions and comments them (Fig. 24.3).
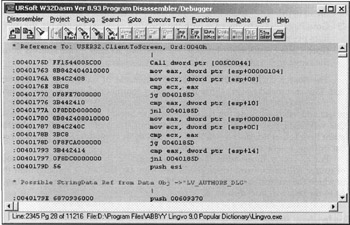
Figure 24.3: Fragment of the disassembled text
To accomplish your work with the module, it is possible to create a project using the Disassembler Save Disassembler menu options. By default, projects are saved in the subdirectory named .WPJ FILES under the W32Dasm working directory. This subdirectory will contain two files: The file with the ALF filename extension will contain the disassembled text, and the file with the WPJ filename extension will contain the project. When you need to restart your work, you can open the project instead of the file. This is accomplished by choosing the Project Open menu commands.
Navigating the Disassembled Text
When navigating the disassembled text, the current line is highlighted. Jumps and procedure calls are specially highlighted. Navigation is further simplified by the Goto menu command:
-
Goto Code Start Go to the start of the listing.
-
Goto Program Entry Point Go to the program entry point (the most important menu item).
-
Goto Page Go to the page with the specified number; by default, the number of lines per page is assumed to be 50.
-
Goto Code Location Jump to the specified address; if the address is missing, the range and proximity to other addresses are taken into account.
The Search menu command is another method of navigating the disassembled text. This command doesn't differ from similar commands found in other programs.
If the current line contains a jump or procedure call, you can jump to the appropriate address by clicking the respective toolbar button. You can continue navigating this way until you detect the required program fragment. The most advantageous point here is that it is also possible to move in the inverse direction. All required toolbar buttons will be automatically highlighted.
Furthermore, those addresses, to which the jump is carried out, contain lists of source addresses, from which the jumps were carried out. If you highlight the line, in which the address is located, and double-click it with the right mouse button, you'll go to the required line of code.
Displaying Data
There are several methods of working with the data.
First, there is the HexData Hex Display of Data menu item, which you can use to view the contents of data segments in hex or string representations. In addition, the program code can be viewed in hex format. For this purpose, use HexData Hex Display of Code .
Second, there is the Refs String Data References menu item. This is a powerful and useful tool. When you choose this menu item, the list of the code lines, to which there are references from the program text, will appear. This list includes everything that the disassembler could detect when analyzing the program. By selecting the required line, you can double-click it and jump to the required program location. If this line is referred to from several locations, you can continue double-clicking to visit all required locations. Fig. 24.4 displays the window containing references to string data types.
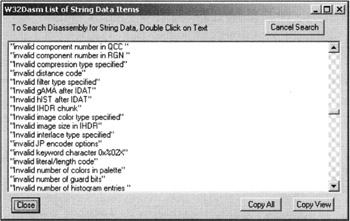
Figure 24.4: Window displaying references to strings
As you can see from Fig. 24.4, it is possible to copy either the selected string or all strings into the clipboard.
Outpuffing Imported and Exported Functions
The list of imported functions and modules is located in the beginning of the disassembled text (Fig. 24.5). In addition, the list of imported functions can be obtained by choosing the Functions Imports menu options. If you select a specific function from the list and double-click it, you'll get all program locations, from which that function is called.
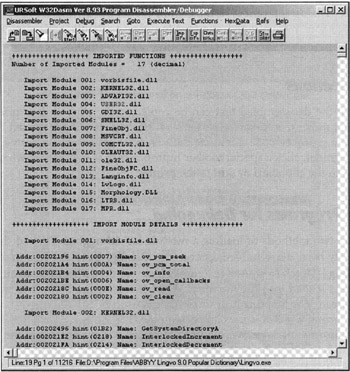
Figure 24.5: Fragment of the list of imported modules and functions
To get the list of exported functions, choose the Functions Exports menu commands.
Displaying Resources
Resources (or, to be more precise, two main resourcesmenu and dialog) are also described in the beginning of the disassembled text. It is possible to work with the list of resources in special windows that can be opened by choosing the Refs Menu References and Refs Dialog references options from the menu. String resources can be viewed in the previously mentioned window for viewing string references (see Fig. 24.4). Unfortunately, this version of the program doesn't recognize other types of resources.
Text Operations
Strings of the disassembled text can be copied to the clipboard or printed. To select the string, move the cursor to its leftmost position and click the left mouse button. To select a group of code lines, use the <Shift> key as well. To copy or print the selected fragment, click a special toolbar button, which is highlighted when the fragment is copied to the clipboard or sent to the printer.
Loading Programs for Debugging
There are two methods of loading a module for debugging. To load the module that has already been disassembled, choose the Debug Load Process menu commands. The Debug Attach to an Active Process menu options allow you to attach and debug the process loaded into the memory. When the debugger loads, two windows appear on the screen. The first one is the information window (Fig. 24.6).
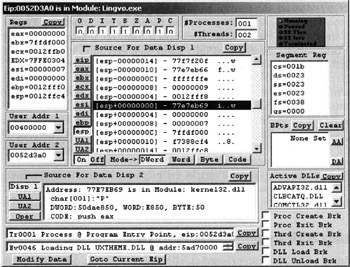
Figure 24.6: First information window of the debugger
The second window is the control window (Fig. 24.7).
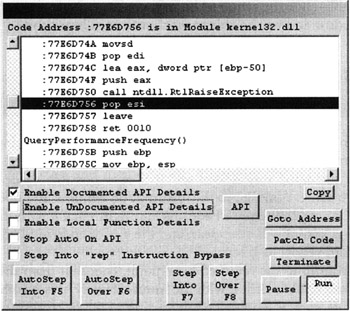
Figure 24.7: Control window of the debugger
The information window contains several list boxes: contents of the CPU registers, processor flag values, breakpoints, contents of segment registers, base addresses, and two data displays. Later in this chapter, I will explain the functions of the buttons located in this window.
Now, consider the control window. The Run button starts the program loaded into the debugger, and the Pause button pauses its execution. The Terminate button stops the program execution and removes it from the debugger. The Step Over and Step Into buttons are intended for step-by-step execution of the program being debugged . The first button executes instructions by stepping over the code of procedures and repeating chains of commands, and the second button executes all instructions sequentially. In addition, there are AutoStep Over and AutoStep Into buttons for automatic step-by-step execution of the debugged program. With an API function, even the use of the Step Into button will not result in step-by-step execution of the function code because this code is not available to user programs. A convenient feature is that in the course of step-by-step execution, the cursor moves synchronously not only in the debugger but also in the disassembler window.
Note that if you are attaching to the process loaded into the memory, then this process will be unloaded from the memory when exiting the debugger, which might result in incorrect operation of the operating system.
Working with Dynamic Link Libraries
To debug a DLL, you can proceed as follows : Load into the debugger the program that accesses the required DLL. Then, view the list of used DLLs. To work with this DLL, you might be required to start the program and execute one of its functions. After you double-click the required library, you'll get its disassembled code in the disassembler window and will be able to work with the library code.
Breakpoints
You can set breakpoints in the disassembled listing. To achieve this, go to the required line of code and press <F2> or press <Ctrl> and click the left mouse button. The breakpoint will immediately appear in the information window and in the control window; the marked command will have the BP* prefix. The existing breakpoint can be deleted in the same way it was set. It is also possible to deactivate the existing breakpoint. To achieve this, go to the information window and open the list of existing breakpoints. Choose the required address and right-click it with the mouse. The asterisk near the breakpoint will disappear, and the line of code in the disassembler window will change from yellow to green.
To quickly jump to the required breakpoint, choose it from the list in the information window and double-click it with the mouse. Finally, it is possible to set breakpoints to specific events, such as loading and unloading a DLL or creating and deleting a thread. These goals are achieved by setting an appropriate flag in the information window.
Modifying Code, Data, and Registers
The debugger allows you to modify the code that you loaded previously. To do so, click the Patch Code button in the control window (Fig. 24.8). It is important to note that only the code loaded into the debugger is modified, not the disassembled text. Having found the required location in the code being debugged, you can modify this code and immediately test the result of modification by running the program. If your modification was correct, you can proceed with modifying the module.
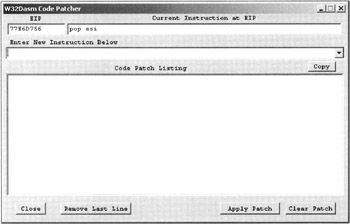
Figure 24.8: Window for modifying the code being debugged
To modify the registers and memory cells of an executable process, there is a special toolbar buttonthe Modify Data button on the toolbar of the information window. This window is shown in Fig. 24.9. At first glance, it might seem that this window is cluttered with elements; however, after you carefully study this window, you'll discover that there isn't anything redundant here. The top part of the window displays the current values of the main processor flags, which you can change. To modify the content of a register or memory cell , first set the modifier value using Enter Value. Then choose the required register and click the button next to it. To restore the previous value, click the R button to the left of the register field chosen . To change the content of the memory cell, first write the cell address to the Mem Lock field and then use the Mem button. Other operations that can be carried out in this window are self-evident
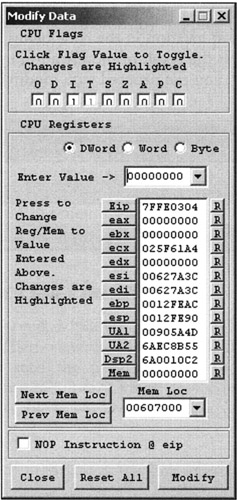
Figure 24.9: Window for modifying the contents of registers and memory cells
Additional Abilities for Working with an Application Programming Interface
The debugger allows you to output additional information about executed API functions. To use this functionality, proceed as follows: Go to the control window and set the following flags: Enable Documented API Detail and Stop Auto On API. Then, press <F5> to start the program execution. Every time the program passes an API function, it will stop and the screen will display information about the specific function.
Searching for the Required Locations in a Program
Quite often, it is necessary to find a location within the disassembled code that corresponds to a specific location within the executable program. The most efficient way of achieving this goal is as follows: Load the required module into the debugger. Then, start it for execution, step to the required position, and click the Terminate button. As a result, the highlighted string in the disassembled code will be at the required position. You should only bear in mind that some programs introduce modifications that remain in force. For instance, the hotkeys can be classified as such modifications.
The use of the W32Dasm will be covered in more detail later in this book.
[i] Although W32Dasm works with modules of different types, only PE modules are considered here.
| | ||
| | ||
| | ||
EAN: 2147483647
Pages: 140