The Softlce Debugger
| | ||
| | ||
| | ||
Softlce (v. 4.05), [i] sometimes referred to as simply Ice, is intended for use under Windows 9x or Windows NT. The debugger includes the kernel-mode debugger; in addition, Softlce has a symbolic loader for loading executable modules into the debugger. The loader allows you to read the debug information for Microsoft and Borland products.
Debugging using Softlce provides the following capabilities:
-
Symbolic and normal debugging of 32-bit applications
-
Debugging drivers for Windows NT and Windows 9x, debugging 16-bit MS-DOS and Windows applications, and debugging system programs
-
Setting breakpoints to the commands located by a specific address
-
Setting breakpoints to read and write operations to or from memory and to input and output ports
-
Setting breakpoints to Windows messages
-
Setting conditional breakpoints, which are triggered if a specific condition is satisfied
-
Getting internal information about the operating system
-
Using the debugger on a remote computer
Softlce implementations for Windows 9x and Windows NT are different. In the first case, it is implemented as a virtual extended driver started from AUTOEXEC.BAT (the WINICE.EXE program). In Windows NT, it is the kernel-mode driver NTICE.SYS.
Installation
Installation of the product is straightforward. The main problem that you'll have to solve during the installation is correctly choosing the video adapter and mouse. As a rule, it is recommended that you choose the standard video graphics array adapter. In this case, there won't be any problems with the video subsystem. Softlce also assumes that the mouse will be used for controlling the debugging process. However, the mouse isn't required; you can work with Softlce without it.
After you complete the installation and reboot the system, you'll probably need to customize the settings in the WINICE.DAT file. General recommendations related to this task are as follows :
-
The PHYSMB=32 line specifies the amount in MB of RAM physically installed on your computer. Edit this string by specifying the actual memory available on your computer.
-
The INIT= string defines the interface settings. I prefer the settings specified by the following String: INIT=SET FONT 1; SET ORIGIN 30 30; LINES 65; WIDTH 90; WR; WF; WD 4; WL; WC 30; X; . You can specify the parameters according to your preferences. You can also change the settings on the fly in the debugger window.
-
In the end of the file, there are commented strings that look as follows: ; EXP=c: \windows\system\kernel32.dll. Uncomment them to enable the debugger to recognize the imported functions from standard DLLs.
-
In Windows 9x, Softlce adds the following string to the end of the AUTOEXEC.BAT file: C:\ICE\WINICE.EXE. If desired, you can comment it out.
Loading a Program for Debugging
Softlce provides a special program called LOADER32.EXE for loading programs into the debugger. It is used for loading 32-bit applications. For loading 16-bit applications, the utilities located in the UTIL16 subdirectory are used.
Consider the LOADER32.EXE program. The loader looks as shown in Fig. 24.10. The sequence of actions that must be carried out to load a program into the debugger is as follows: Open the module, translate the module by converting the debug information into an NMS file, then load the module. If the debugger has correctly interpreted the debug information, the program text will appear in the debugger window; otherwise , you'll have to work with the disassembled code. After loading the module, you'll be able to customize the module startup in the debugger using the Module Setting menu options (Fig. 24.11). The procedure is straightforward; therefore, I will not cover the options of this window in detail.
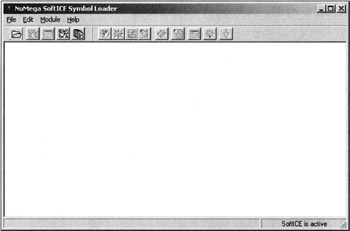
Figure 24.10: Softlce loader (LOADER32.EXE)
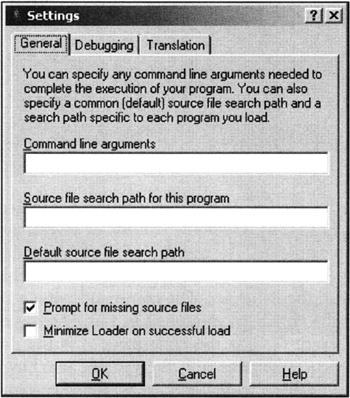
Figure 24.11: Module startup customization window in Softlce
Overview of the Debugger Commands
-
Calling the debuggerTo call the debugger, press <Ctrl>+<D>. To close the debugger, press the same shortcut combination. It is also possible to close the debugger by pressing <F5>.
-
HelpTo get the list of all commands, issue the h command in the command window. To get information about a specific command, enter h <command_name> , where command_name stands for the name of the required command. The lower part of the command window is the help pane, which displays tips for the user . For example, if you enter w (the first letter of all window commands), the pane would display the list of all commands, the names of which start with w .
-
Working with windowsWhen the debugger is called, its window appears on the screen (Fig. 24.12.). This window consists of several panes, each intended for displaying specific information. The number of panes and the size of the initially displayed window are defined by the initialization setting; however, this can be changed as needed while working with the debugger. The command pane is intended for entering commands. Usually, the cursor is positioned in this pane. Every pane has its mnemonic designation, for example, c is the code pane, d is the data pane, r is the registers pane, f is the coprocessor pane, w is the variable watching pane, s is the stack pane, l is the local variables pane, and x is the Pentium III registers pane. The <Alt>+ <window_mnemonic> command allows the user to switch to certain windows. The task of detecting whether such switching is possible for a specific window is easy. To switch back, it is sufficient to issue the same command. If a specific window is missing, it can be created by issuing one of the commands, in which w is the first character, followed by the mnemonic designation of the required window. For example, if the data window is missing, you can issue the wd command to create it. The same command will remove the data window from the list of displayed windows. Window height is specified by the command parameter, for example: wc 20 . I recommend that you memorize some other useful commands: <Ctrl>+<
EAN: 2147483647
Pages: 140