Background to This Research
|
An initial study (Mills et al. 1996) was carried out with four representative purchasers and three providers of technological R&D services (n = 13) to assess the satisfaction of senior program and project managers with current practices by using in-depth, partially structured interviews. A second study (Mills et al. 1999) assessed six successful companies (two each from the electronics/manufacturing, food-processing, and forestry industries) (n = 12) by the same method as the initial study. Annual turnover, R&D expenditure, and number of respondents for each organization are shown in Table 1.
| Organization Type | Code | Turnover (NZ$m) | R&D Expenditure (NZ$m) | Interviewees from Earlier Research | TIPS Survey Respondents |
|---|---|---|---|---|---|
| R&D Purchasers | P1 | Not Applicable | 259 | 2 | 1 |
| P2 | Not Applicable | 8 | 1 | 0 | |
| P3 | Not Applicable | 3 | 1 | 1 | |
| P4 | Not Applicable | 1 | 1 | 1 | |
| R&D Providers | R1 | 87 | 70 | 2 | 1 |
| R2 | 44 | 38 | 3 | 1 | |
| R3 | 10 | 7 | 3 | 1 | |
| Electronics Companies | E1 | 50 | 2 | 2 | 2 |
| E2 | 20 | 1 | 2 | 2 | |
| Food Companies | F1 | 2500 | 5-30 | 2 | 2 |
| F2 | 1000 | 5-30 | 2 | 2 | |
| Forestry Companies | T1 | 3000 | Not Available | 2 | 1 |
| T2 | 480 | 10 | 2 | 1 |
All organizations used Gantt charts and all companies and research providers used Microsoft Project software, but only for planning, as the costs and effort to maintain frequently changing schedules were too high. Three of the six companies had instituted stage-gate processes to some degree, which helped tie projects into the organization. However, none of the stage-gate processes was fully functional. Formal monitoring and control were inconsistently applied to suit individual project and business reporting requirements, making project comparison within organizations for portfolio reviews difficult. A key finding in the two investigations was that only one of the twenty-five managers was satisfied with current practices; all desired improvement and were altering their organizational systems to better accommodate change introduced as a result of new information or knowledge.
Therefore, a new approach called TIPS was conceived and developed to accommodate the need to align individual projects with programs and business purposes, and to respond to increased individual accountability in the context of uncertainty in a rapidly changing environment. Figures 1 and 2 compare the tightly scoped array of traditional innovation projects against a typical innovation spectrum with the more universal scope of a TIPS innovation project.
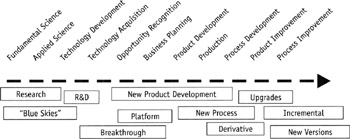
Figure 1: Traditionally Managed Innovation Projects
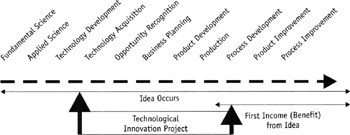
Figure 2: The TIPS Universal Innovation Project
Ten fundamental differences in philosophy between traditional and TIPS project management are:
-
Projects always start now and always finish when benefit (income) is received.
-
Project achievement goals are synchronized to the business calendar (weeks, months, quarters).
-
TIPS recognizes achievement, not activities, which helps create motivation and urgency.
-
Projects are monitored and controlled in relation to maximizing delivery of currently estimated future benefit and are not aligned with past plans and forecasts.
-
All past project cost and effort is considered as sunk, or in current terminology, invested in new knowledge.
-
TIPS projects are replanned from a zero base at the end of each time-block to incorporate new knowledge.
-
Each project is regularly reviewed in the context of project portfolios and assigned a unique priority rank within the organization.
-
Resource allocation is done on the basis of project priority ranking by empowered staff, rather than through the dictates of a central planning function.
-
TIPS acknowledges, quantifies, and standardizes risk estimates.
-
TIPS information is formatted for convenience and practical use.
In concept, TIPS can be considered as a Gantt chart where all project activities are allocated to sequential, equal-sized blocks of time (weeks, months, or quarters). Each time-block is allocated a description related to the focus of activity, goal, or milestone to be accomplished in that period (Figure 3). The nominal cost of each time-block and the probability that the time-block goal could actually be achieved are identified. The uncertainty of goal achievement by the end of the time-block is described using two duration estimates (optimistic and pessimistic).
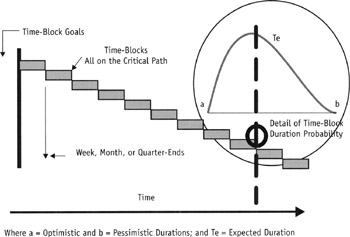
Figure 3: The TIPS Concept as a Gantt Chart
By definition all time-blocks are on the critical path and the uncertainty of completion can therefore be readily calculated (we use a beta probability distribution after MacLeod and Petersen 1996). The latest estimated net present value (NPV) of the project benefit is transparently calculated and all key attributes for project and portfolio analysis and project ranking identified. Project rank disclosure enables individuals (in conjunction with their supervisors) to judge the best use of their time. Unlike a Gantt chart there is no need for or benefit from actually plotting activities against time. At the end of each time-block the project is reviewed and may be completely revised. All costs are considered sunk and new knowledge gained incorporated into the improved plan.
The TIPS approach we have developed uses Microsoft Excel spreadsheet software to encapsulate key project dimensions for reporting and decision-making, shown in Figures 4 and 5.
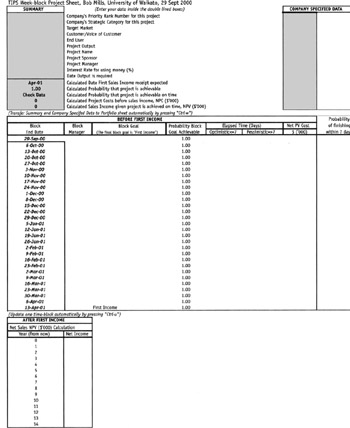
Figure 4: TIPS Project Sheet for Weekly Time-Blocks
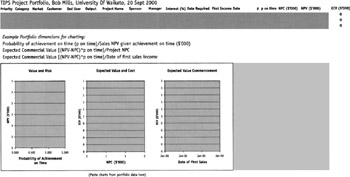
Figure 5: TIPS Portfolio Sheet
This chapter summarizes recent TIPS research, including the response of the original interviewees to this new and alternative approach and presents findings of pilot trials done late in the year 2000 (detailed in Mills et al. 2000 and Mills et al. 2001).
|
EAN: 2147483647
Pages: 207