Analyzing the Stakeholder Map
|
Once the stakeholder map is prepared, it can be analyzed using a power/interest matrix (Johnson and Scholes 1999, 2002). There are two dimensions to the matrix—the level of interest of the stakeholder in the project and the stakeholder's power to influence the definition of the project mission. These yield the four basic categorizations of stakeholders shown in Figure 1.
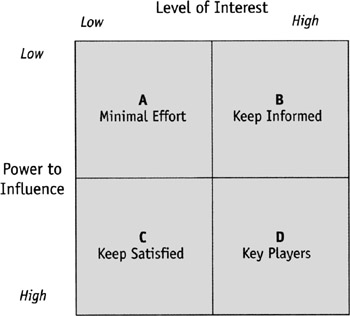
Figure 1: Categorization of Stakeholders (Johnson and Scholes 1999, 2002—Reprinted with Permission from Pearson Education Limited)
Those in category A require minimal effort, but should still be watched in case their power or interest rises as circumstances change. Those in category B need to be kept informed of progress and, because many of those who hold alternative definitions of the project mission may be in this category, be treated with diplomacy. Again, signs that stakeholders here may gain power need to be watched for. Those in category C need to be kept satisfied. Often this group will include second-tier financiers who treat the project simply as another investment opportunity—their power over the project is considerable, but their interest may be fairly low, as they would simply remove their finance if not satisfied. Into this category also go those hired by the client to execute the project. While such stakeholders—particularly designers and financial advisors—may have considerable influence over the project mission, they are likely to be treating the project as one of many on which they are involved. They are also often insured against major project failures, or—more frequently in the case of contractors—will be using portfolio techniques to spread risks associated with the project. The final group (D) are the key players—those committed totally to the project, such as the client; the first-tier financiers; and those on the supply side who are betting their company on the project for one reason or another.
The degree of integration of the stakeholder map will make a large difference in its manageability. If the stakeholders are at the far corners of Figure 1, then the definition process is likely to be turbulent and the process map unstable. If the stakeholders are clustered near the center of Figure 1, then the map will appear as relatively stable. The dispersion of the different stakeholders in the power/interest matrix will indicate the options of maneuverability in the project manager's decision and planning processes and the ability to broker compromise by renegotiating the project mission.
|
EAN: 2147483647
Pages: 207
- Using SQL Data Definition Language (DDL) to Create Data Tables and Other Database Objects
- Using SQL Data Manipulation Language (DML) to Insert and Manipulate Data Within SQL Tables
- Working with Comparison Predicates and Grouped Queries
- Writing External Applications to Query and Manipulate Database Data
- Monitoring and Enhancing MS-SQL Server Performance