Analyzing the Project Network Diagram
One of the most satisfying accomplishments in IT project management is to step back and, looking at the PND, follow the project conception through each task to the final deliverable of the project. Don t get too infatuated ”this network diagram will likely change.
Now that the PND has been constructed , you can find the critical path . The critical path is the sequence of events that determine the project completion date. The critical path is the longest duration from project start to project completion. For example, imagine that you have created and analyzed your network diagram. Most likely there are multiple paths from project start to completion. One of the project paths will take longer than any of the other paths. This is the critical path. It s called the critical path because if any activities on it are delayed, the project completion date is also going to be late.
Calculating Project Slack
Given you know that activities on the critical path cannot be delayed, what about activities that are not on the critical path? Can these projects be delayed? Yes, usually they can ”but there is a limit to the amount of time an activity not on the critical path can be delayed. This limit is called slack. Sometimes you might see slack as float, but it s the same business. There are three different flavors of slack, or float:
-
Free slack This is the total time a single activity can be delayed without delaying the early start of any successor activities.
-
Total slack This is the total time an activity can be delayed without delaying project completion.
-
Project slack This is the total time the project can be delayed without passing the customer expected completion date.
Most project managers allow their project management software to calculate the available slack on each activity, but it s really not that hard to do manually. To find the slack for each activity, you ll first find the earliest possible start date and the earliest possible finish date for each activity by completing what s called the forward pass. Once you ve got this info , you do just the reverse through the backward pass ”you ll find the latest possible start and latest possible finish date for each activity. There are a few different methods for calculating project slack. Here s one of the most common approaches.
For this example, we ll be using a simple network diagram as seen in Figure 7-7. (You can print out Figure 7-7 from the CD if you d like; it s in Adobe Acrobat format.) If you examine the network diagram, you ll see there are two simple paths to completion: ABDF and ACEF. The number over each node represents the duration of the activity. If you add up the duration of each path, you ll find the critical path ” the longest path to completion. In this example, it s ACEF because it takes 17 days while ABDF only takes 15 days.
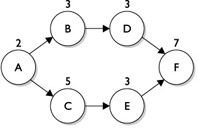
Figure 7-7: The longest path to completion is the critical path.
Now let s try the forward pass. (Again, there are different methods of completing this science, so don t be alarmed if you ve been exposed to a different one). Follow these steps:
-
Make the Early Start (ES) for Activity A one because you ll start on Day one. Add the duration of the activity to the ES and you ll have three. Now this part trips some folks up: you ll subtract one day from the value of the ES and the task duration to arrive at the Early Finish (EF) of the activity. The reason is that the duration of Activity A is only two days, not three, right? In other words, if you start on Day one, you should have two days of work to get to Day two. The EF for Activity A is two.
-
The next activities are Activity B and Activity C. The ES for both of these will be three. Why? Because Day three is the next day in the schedule, the earliest possible day to begin either activity.
-
Let s finish the ES for activities B, D, and F first. The EF for Activity B is the ES, plus the duration, minus one, for an ES of five. The ES for Activity D is six and the EF for Activity D is eight. The ES for Activity F is 9 and the EF for Activity F is 15.
-
Now let s do activities C, E and F. The ES for Activity C is three and the EF is seven. The ES for Activity E is eight and the EF is ten. Activity F is the last activity in the project so you can bet it ll be on the critical path ”with no slack. The ES for Activity F is actually 11. It s 11 because Activity F cannot begin until your project team completes Activity E. So, the EF for Activity F is actually 17. Figure 7-8 shows the project updated with all of the ES and EF dates.
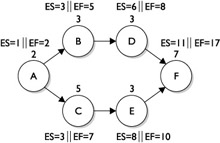
Figure 7-8: The ES and EF dates are found by completing the forward pass.
Now that the forward pass has been completed, it s time to do the backward pass. It s a cinch; just follow these steps:
-
You ll begin with the last activity in the Network Diagram, Activity F, which has an EF of 17. You ll make the Late Finish (LF) the same as the EF value: 17. This is because Day 17 is the latest day the project can finish without being late.
-
The Late Start (LS) for Activity F is the LF value, minus the duration of the activity, plus one. Yes, plus one. Because you re going backward in the network you ll add one rather than subtract one. This accounts for the full day of work you have completed on the first activity and the last activity. So, Activity F has an LF value of 17, less the duration of seven, plus one, which equals an LS of 11. It s no coincidence that the EF and the LF have the same value of 17. It s also no coincidence that the ES and LS have the same value of 11. It is because this activity is on the critical path.
-
Next let s do activities D, B, and A. The LF for Activity D is ten ”one day prior to the ES of Activity F s LS. You get the LS for Activity D by subtracting the duration of the activity, plus one, which equals eight. The LF for Activity B is seven and the LS for Activity is five. The LS for Activity A is, well, it s the first activity in the project. Do you think it ll have any float? Hey! You re right ”it s on the critical path so we can skip it for now.
-
Let s go back and complete the backward pass for E, C, and A. The LF for Activity E is ten and the LS for Activity E is eight. The LF for Activity C is seven while its LS is three. The LF for Activity A is two and it s LS is one. Figure 7-9 shows the completed backward pass.
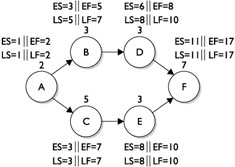
Figure 7-9: The backward pass reveals the LF and the LS.
To finalize the process of finding slack, you ll subtract the LF from the EF and the ES from the LS on each activity. Wherever there s a zero, you have a task on the critical path; wherever there s a number, the activity has slack. In this example, activities B and D have two days of slack. Okay, technically they both don t have two days of slack; there s two days of slack on the whole project. Or you could say, Activity B and Activity D can each have one day of slack, or either day can have two days of slack. However you slice it, if either activity goes two days beyond its expected completion time this project is late.
Adjusting the Project Schedule
Once you ve found the critical path information, you can then apply this time to a calendar and, after accounting for holidays and weekends, a target completion date can be predicted based on the project start date. Chances are the target completion date your network diagram predicts and the target completion date requested by management or your client won t be the same. The date that you have computed will typically be beyond the date management has requested . (Funny how it always seems to work out that way.)
What you will now have to do is adjust and readjust the critical path. This is known as schedule compression . By making adjustments to when tasks begin or by adding additional resources, you can complete the same work in less time.
There are four processes you can do to affect the flow of project schedule:
-
Fast tracking This method allows activities to be done in parallel that would normally be done in sequence. For example, you may allow two phases of the project to overlap slightly where normally you d have quality control events, walkthroughs, or other events scheduled before the second phase of the project would be allowed to begin. This approach usually increases project risk.
-
Crashing Crashing allow the project manager to add more resources to effort-driven activities in an attempt to shorten their duration. For example, if you have to physically install 1,000 workstations and you ve only eight people assigned to the task, it may take them months to complete. If you crash the project, you might assign 16 more people to this task to complete it in a matter of weeks. Crashing doesn t always work because some activities are a fixed duration and additional labor won t ensure the activities will finish faster. Crashing usually increases project costs because of the expense of the labor.
-
Lead time Lead time is negative time because it brings activities closer together ”even allowing them to overlap. For example, you may have to install a new network cable throughout a campus. Your schedule calls for all of the network cables to run before any PCs plug into the new network. To speed up the schedule, you elect to allow the activity to connect the PCs to the new network as soon as half of the new cables are ready. The first activity, to run the network cables, does not have to be complete for the second activity, connecting to the new network, to begin.
-
Lag time Lag time is waiting time. It s often applied to activities where there must be an added duration between the tasks. For example, after installing a database, you have to wait four hours for all of the records from other databases in the network to recognize the database and synch with this database server. Lag time adds time to the project schedule.
To begin schedule compression, do the following:
-
Analyze the critical path to move tasks earlier in the workflow ”where possible.
-
Consider relationships between tasks to change FS to SS.
-
Identify tasks that require lag time and evaluate the predecessor task to move it earlier in the workflow.
-
Consider any tasks and the level of acceptable risks by changing relationship types.
-
Consider adding additional resources to tasks to shorten the duration required to complete tasks. (Not all tasks can be shortened with additional resources.)
EAN: 2147483647
Pages: 195