Ensuring Quality Throughout the Project
As your project moves along through each process group , over hurdles, and through barriers, you ll need a proven system to check the quality of your progress. You may subscribe to any one of multiple theories in the world of project management to test the quality of your project. All of these theories , however, have one common thread: work completed must be proven to be in alignment with the project deliverables. This is scope verification ”the process of ensuring that the project is creating what the customer has asked for.
For example, a project to create a new application for an organization will have several milestones in its path to completion. The desired deliverable of this project is that the application will allow users to submit HR forms through a company web site. The project manager can check the work in progress to verify that it is in alignment with the project deliverable . Should the work be out of alignment, the project manager must take immediate corrective actions to nudge the work back on track.
Planning for Quality
Quality planning is a process to determine which quality standards are relevant to the project, and how they can be implemented. Planning for quality is a fundamental exercise in the planning phase ”each deliverable must have metrics that prove its quality. In IT, this can be bandwidth, latency, database accuracy, the speed of an application, and more.
Your organization may have a quality policy that dictates the expectations of a project in regard to quality, how the expectations are measured, and what the outcomes of those measurements should be. This quality policy is considered and applied to the project scope, which is important because the project scope contains all of the work your project will undertake. What good is a quality policy if it s not implemented with the project work?
Depending on your organization, you may also have relevant standards and regulations that will serve as input to your quality planning. A regulation is a law or practice that is not optional in your industry. For example, the health care industry has the Health Insurance Portability and Accountability Act (HIPAA) regulations as well as other regulations it has to be abide by. A standard, on the other hand, is a rule or generally accepted practice within an industry. For example, most software application windows close using some button in the upper-right hand corner. While there s no law that says this is a must, it s a generally accepted standard regardless of the application or operating system.
When you re planning for quality, there are five major approaches you can rely on:
-
Benefit-cost analysis Within every project, there will be a demand for quality ”and a cost to reach that demand. A benefit-cost analysis considers the cost to reach the level of quality in relation to the benefits of obtaining the quality. For example, a customer may demand that a series of databases provide 100-percent accuracy 24/7. While this seems good, the synchronization of multiple databases after each change may result in a very costly solution. Instead of the expensive 100-percent solution, a better solution, for example, may be a less costly approach that ensures 98-percent accuracy.
-
Benchmarking This approach uses other projects as a measure of performance on your current project. It examines the deliverables, the project management processes, and the successes and failures within each project to measure how the current project is performing. The problem with the approach, especially in IT projects, is that unless the nature of the IT projects is the same, it s difficult to use. You can t measure the performance metrics of a project to develop an application against the metrics of a project to create a new network. Additionally, because technology is changing so rapidly , benchmarks that were applicable 18 months ago are very likely outdated and inappropriate.
-
Flowcharting Flowcharting shows how the components within a system are related as shown in Figure 10-6. This is an ideal approach within IT. Consider an application that follows a client-server model. The front end and the back end application must communicate over a network or series of networks. A flowchart can illustrate the various components, how they interact, and their effect on quality. Another example of a flowchart is a cause-and-effect diagram to illustrate the causes that are contributing to the quality defect within the project. These diagrams are also Ishikawa, or fishbone, diagrams.
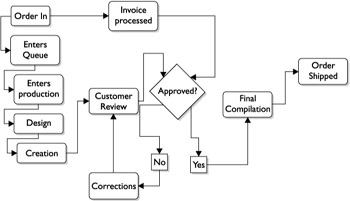
Figure 10-6: Flowcharting shows how the components within a system are related. -
Design of experiments This approach relies on statistical what-if scenarios to determine which variables within a project will result in the best outcome. The design of experiments approach is most often used on the product of the project, rather than the process of the project itself. For example, a project team creating a new network may experiment with the capacity of the network cable, the network switches, the routers, and the number of the network cards on the servers to determine which is the best combination for the best price. Design of experiments is also used as a method to identify which variables within a project, or product, are causing failures or unacceptable results.
-
Cost of quality analysis Cost of quality is the sum of all the costs to achieve the expected quality the customer demands in the project deliverables. This includes all of the work to conform to the quality requirements and the expense incurred from nonconformance to the quality requirements. The cost of nonconformance is most evident when work needs to be redone and there s wasted materials. Technically, the cost of quality has three costs: prevention costs, appraisal costs, and failure costs. Failure costs are associated with what could happen if the project fails: the lack of sales, loss of customers, product returns, fines and fees, downtime, and so on.
Traditional Quality Assurance
Quality assurance (QA) is a series of actions and requirements to assure the organization that each project will meet the relevant quality standards. QA is typically mandated on an organization-wide, or departmental-wide program or quality system. For example, if your company uses Six Sigma or is ISO 9000 certified, your project will have quality standards that it will have to map to under these guidelines and regulations. QA is concerned with the systematic activities that are applied to each individual project to ensure that quality exists.
To implement quality assurance, you ll first follow parent organizational procedures that may be established for your projects. These can include reports , forms, audits , and other quality-assuring activities. Quality assurance is prevention-driven, in that the goal is to prevent a lack of quality. The same tools a project manager uses for quality planning can also be applied as part of the QA process:
-
Benefit/cost analysis
-
Benchmarking
-
Flowcharting
-
Design of experiments
-
Cost of quality analysis
Depending on the nature of your project and organization, your project may also undergo quality audits. A quality audit is a formal review of the quality management activities you have in place within your project. Quality audits can be completed in-house by QA professionals your organization employs or by third-party experts.
Traditional Quality Control
As you now know, quality is measured by the end result of a project. Obviously you cannot wait until the end of a project to determine if quality exists. Quality control (QC) is concerned with the quality of the actions and deliverables within a project. QC is inspection-driven; QC reviews the deliverables to establish that the quality expected by the project stakeholders is present.
QC is also concerned with the root cause of results that are below the quality standards, and with eliminating the issues that are causing quality to slip so that quality issues are not repetitive. It focuses not only on the product of a project, but also on the project management process itself. For example, QC is used to determine why cost and schedule variances have occurred and what corrective actions can be enforced to ensure the same mistakes don t happen again.
QC requires the project manager to have some understanding of statistical analysis, sampling, and probability to track trends, predict quality results, and determine root causes in quality issues. Trend analysis is especially useful in IT projects as most work within an organization is cyclic. For example, the network servers take a processor hit every morning as users log on to the network, check their e-mail, and open files. In the afternoon, the proxy servers may have an increase in Internet traffic as users check the news, the weather, or the traffic for their commutes home. In an IT project, trend analysis can allow the project team to make educated decisions on how to react to conditions within the project.
QC must be managed throughout the project. It s unacceptable to wait until the project is ended to see if the deliverables are of quality. The project management must get out, look, listen, and inspect. Throughout the project there are four fundamental facts about quality control:
-
Prevention keeps quality errors out of the project. Inspection keeps quality errors away from the customer.
-
Attribute sampling means the results meet the expected quality standards or they don t. Variables sampling tracks the level of acceptability of the results over time.
-
Within a project you have special causes where quality excels or diminishes due to anomalies within the project. Otherwise you expect the results to vary as part of the project; this typical variance is simply called random causes.
-
A tolerance is an acceptable range of quality for the project or deliverable. Control limits are the outer and upper limits that the quality results must fall within. If results are within the limits, the project is in control. If the results are out of the limits, it s considered to be out of control.
Implementing Quality Control
Know this: quality is planned into a project, never inspected in. A goal for any project is to achieve quality by planning for quality ”and then following the plan. But how will you know if quality exists on a project unless there is accountability? Sure, you could wait until your project is complete and then test out the deliverables, but that s a little late. Quality control must happen throughout the project to ensure that quality exists.
The most accessible method to ensure quality is inspection. Once you inspect the work, you can measure and react to the evidence you and your project team have found. There are many different approaches to inspecting the project deliverables. Here are four of the most common:
Peer Review
One approach to QC throughout an IT project is to use peer review. Peer review, as its name implies, is the process of allowing team members to review each other s work. It is an excellent method to ensure that each team member is completing her work and doing an excellent job. Peer review provides for many things, including
-
Ensuring that each task is checked for quality
-
Allowing a team member to show others her work
-
Allowing a team member to learn about other areas of the project
-
Allowing the project manager to ensure the work is being completed
-
Holding the team responsible for the quality of the work completed
The risk involved with peer review QA is that not all team members are up to the challenge of reviewing another s work or having their work reviewed by an equal. If you use this approach, your team members must have confidence in each other s ability to fairly review other members work, and confidence in their own abilities to complete the assigned tasks .
Statistical Sampling
Statistical sampling is the process of choosing a percentage of results at random. For example, a project creating a database and web site to sell concert tickets may require a measurement of database accuracy, the speed of the web site, and the functionality of the overall program. This testing must be completed on a consistent basis throughout the project, rather than on a hit-and- miss basis.
Statistical sampling can reduce the costs of QC, but mixed results can follow if an adequate testing plan and schedule are not followed. The science of statistical sampling, and its requirements to be effective, is an involved process. There are many books, seminars , and professionals devoted to the process.
Management by Walking Around
One of the most successful methods for managing quality is to allow yourself to be seen. Get out of your office and get into the working environment. You don t have to hover around your team, but let them know you are available, present, and interested in their work.
So many IT project managers have a fear of being disliked, or seen as typical management, or consider themselves too important to speak with their team. These less-than -successful project managers alienate themselves by hiding in their offices, ignoring the opportunity to work with the project team to ensure quality from the get-go. Don t let this happen to you! Get involved with the project team members and make yourself visible.
Reviews by Outside Experts
Hire an outside expert to review the project as it progresses. This approach allows the project manager, who may not be as skilled as his team on the project s technology, to ensure the team is completing the assigned work with care and precision. A consultant can be brought into the project at key milestones to make an unbiased review of the work done to date. The consultant can accomplish many things for a project s success. This practice
-
Ensures quality and accuracy
-
Allows for an unbiased review by a third party
-
Creates accountability for the team completing the work
-
Allows the project manager to know the true status of the work
-
Allows the project manager to make any needed adjustments
Analyzing Quality
Once you ve completed the inspection of the project and the product deliverables, now what? Of course, you ll be doing QC inspections on a regular basis, so you ll need to track and analyze the results. You ll want to complete root cause analysis to determine why quality issues may be random or repetitive. There are five major approaches to tracking and analyzing quality:
Using Control Charts
A control chart displays the results of your inspections over time. The results of inspections are plotted out against a mean, and an upper and a lower control limit. As you can see in Figure 10-7, the results of inspections are measured and then added to the control chart. When results are over the control limit, they re out of control; otherwise, the project is acceptable. However, this approach can be a little tricky in many IT projects. Control charts are best when you have projects that are extremely repetitive, such as manufacturing and construction projects. That s not to say that you still can t use these charts within IT projects ”just be aware that the results of your measurements may fluctuate as the nature of the work within the project changes. You can use control charts to track server usage, update, network throughput, and more.
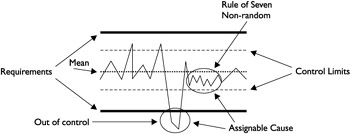
Figure 10-7: Control charts measure results over time.
When results of a measurement fall out of control, this is called an assignable cause. An assignable cause means there is some reason for this event to occur. It could be a hardware error, a different developer, or some other reason. It s a signal that root cause analysis is needed. In addition, whenever seven results of your testing all fall on one side of the control chart s mean, it s called the Rule of Seven and is also an assignable cause. There will always be some reason why the quality has stymied on one side of the mean or the other. Again, time for root cause analysis.
Using Pareto Diagrams
A Pareto diagram is somewhat related to Pareto s Law: 80 percent of the problems come from 20 percent of the issues. This is also known as the 80/20 rule. A Pareto diagram illustrates the problems by assigned cause from smallest to largest as Figure 10-8 shows. The project team should first work on the largest problems and then move onto the smaller problems.
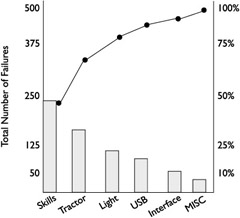
Figure 10-8: A Pareto diagram is a histogram ranking the issues from largest to smallest.
Revisiting Flowcharting
Remember flowcharts? Flowcharting is a method to chart how the different parts of a system operate . Flowcharting is valuable in QC because the process can be evaluated and tested to determine where in the process quality begins to break down. Corrective actions can then be applied to the system to ensure quality continues as planned ” and expected.
Applying Trend Analysis
Trend analysis is the science of taking past results to predict future performance. Sports announcers use trend analysis all the time: The Cubs have never won in Saint Louis, on a Tuesday night, in the month of July, when the temperature at the top of the third inning is above 80 degrees.
The results of trend analysis allow the project manager to apply corrective action to intervene and prevent unacceptable outcomes. Trend analysis on a project requires adequate records to predict results and set current expectations. Trend analysis can monitor
-
Technical performance Trend analysis can ask, How many errors have been experienced by this point in the project schedule, and how many additional errors were encountered ?
-
Cost and schedule performance Trend analysis can ask, If we are $4,000 over budget now, what is our final cost likely to be?
Total Quality Management
No book on project management would be complete without at least a nod to Total Quality Management (TQM). Total Quality Management is a process that involves all employees within an organization working to fulfill their customers needs while also working to increase productivity. TQM stems from Dr. W. Edward Deming and his management principles, which the Japanese adopted after WWII. In the U.S., these principles were readily adopted in the 1980s after proof of their success in Japan.
The leading drive of TQM is a theory called Continuous Quality Improvement . According to this theory, all practices within an organization are processes, and these processes can be infinitely improved, which results in better productivity and ultimately higher profitability.
Here s how this relates to IT project management: the processes a project manager utilizes to communicate, schedule, and assign resources can be streamlined, improved, and modernized to make the project easier to implement and more profitable as a whole. Examples include Microsoft Project Server and other web solutions for project teams .
In project management, the customer is the end user of the deliverable, and the concept of streamlining processes is dependent on the project manager and the project team. Scores of books have been written about Total Quality Management, though one of the best books, Out of the Crisis , is from the concept s originator, Dr. W. Edwards Deming.
Quality project management as a process is not a magical formula, an equation you can map out in Excel, or a dissertation from a business professor at Harvard. It is a simple thing to describe, but fairly difficult to implement. Quality project management comes from the dedication of the project manager and the project team to completing with gusto the required activities in each phase to produce an excellent deliverable. Anything less should be unacceptable.
EAN: 2147483647
Pages: 195