Adding an OLAP Grid to an Existing Report
You probably will encounter situations in which you want to create a standard database report that includes one or more OLAP grids. By choosing the Blank Report option or other wizards from the Report Gallery, you have more flexibility in creating this type of report. Simply create the base report using the techniques discussed elsewhere in the book.
You may even find it useful to base the main report on some fields from your OLAP database. To use the OLAP database for the main report, choose the OLAP entry under the Create New Connection category of the Database Expert. The OLAP Connection Browser (shown earlier in the chapter) will appear, where you can choose an OLAP cube. You can add as many of these cubes or tables as necessary for the report. Depending on the type of OLAP database you ve chosen, the Field Explorer will show the dimensions and members for your chosen cubes, or the fields in the chosen tables. You can add these fields to your main report as you would a regular database field. You may need to try some experimentation to determine which dimensions or fields can be used ”OLAP data often doesn t behave the same as relational database data. Once the main part of your report is finished, you can add the necessary OLAP grid objects.
| Caution | Even though you can access the OLAP cube by using the Blank Report option, you won t be able to actually include any cube values in any report sections. You ll only be able to include and manipulate dimension names . The only way to actually include the numeric values from the cube is to create an OLAP grid object. |
Adding an OLAP Grid Object
To create an OLAP grid on an existing report, click the OLAP grid toolbar button in the Insert Tools toolbar or choose Insert OLAP Grid from the pull-down menus . The OLAP Expert appears.
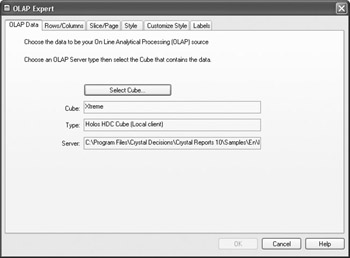
The tabs in the OLAP Expert behave almost identically to the same sections in the OLAP Report Creation Wizard, described earlier in the chapter. Follow the same steps for the Data and Rows/Columns tabs to choose the cube and dimensions for your OLAP grid. You may also use the Style and Customize Style tabs to format the OLAP grid, similar to formatting a cross-tab object (covered in detail in Chapter 11). Three of the tabs deserve more discussion, however: the Slice/Page tab, the Customize Style tab, and the Labels tab.
Slice/Page Tab
Notice that the Page dimension list and the Parameter field buttons that appear with the OLAP Report Creation Wizard are unavailable here, and a note suggests that you use the Wizard if you want to use these features. If you want to have several cubes work as pages, you can either re-create the report using the Wizard or add multiple OLAP grids to your report, specifying a different slice for each grid to mimic the Paged dimension process discussed in the Wizard portion of this chapter.
Customize Style Tab
This tab is identical to the same tab used to format cross-tab objects (see more information on this tab in Chapter 11). Options you choose on this tab change formatting options, such as background color , grid line formatting, and Alias for Formulas, which lets you give a shorter, more meaningful name to a column or row for use in conditional formatting.
OLAP Labels
Many OLAP cubes of even moderate complexity often contain many dimensions. However, unlike a slice and dice OLAP analysis tool, the OLAP grid object that initially appears in the Preview tab or appears when you print or export the report doesn t offer a high level of interactivity (although the OLAP Analyzer, discussed later in the chapter under The OLAP Worksheet, does provide high interactivity). Accordingly, you ll probably use only a few (if not just one) dimensions for a row and column. The remainder of the dimensions not actually appearing as a row or column (often called qualified dimensions) can simply be ignored, used as Slice dimensions, or used as Page dimensions. Of particular interest is how the report viewer will know what settings have been made for Slice dimensions: if the OLAP grid is limited to just one product, one gender, and one store, how will this be known? The answer is OLAP labels.
When you create an OLAP grid object either with the OLAP Wizard or by inserting an OLAP grid manually, OLAP labels are added to the OLAP grid by default, as shown here:
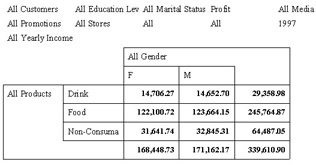
Notice that any Filter dimensions, such as 1997, are listed. Otherwise, the All designations appear. This indicates to the report viewer what limits have been placed on the OLAP grid. You may choose to limit the set of OLAP labels that appear ”perhaps to just the ones that are used as a Filter dimension. Or, you may want to otherwise customize the way the OLAP labels appear. To do this, click the Labels tab, shown in Figure 19-5.
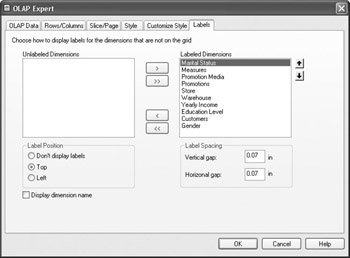
Figure 19-5: The Labels tab
By default, all qualified dimensions (those that are in the cube, but not included as a row or column on the grid) are placed in the right Labeled Dimensions box. You can change the order in which they will appear next to the OLAP grid by selecting a label and using the small arrows above the box to move it up or down in the list. If you don t want a particular label to appear with the grid, select it and click the left arrow to move it to the Unlabeled Dimensions box.
You can also customize the amount of white space Crystal Reports will place between the labels by specifying a new value in the Vertical Gap and Horizontal Gap text boxes. You can choose to place the entire set of labels on the top or left side of the OLAP grid (or not have the labels show up at all). And finally, you can check the Display Dimension Name check box to replace the All <value> label with <Dimension> = <value> for labels.
After you make your desired choices in the OLAP Expert, click OK. An outline of the OLAP grid object will be attached to the mouse cursor. Drop the object in the desired section of the report.
You may make changes or additions to the OLAP grid object by selecting it and then formatting the OLAP grid by using pull-down menu options, the Format button in the Expert Tools toolbar, or format options from the right-click pop-up menu. You can also format individual parts of the OLAP grid, as discussed later in the chapter under Controlling OLAP Grid Appearance.
EAN: N/A
Pages: 223