Using the OLAP Report Creation Wizard
The OLAP Report Creation Wizard is available from the Report Gallery that appears whenever you create a new report. Just click the OLAP button to use the expert.
The Data dialog displays first in the Report Creation Wizard, to allow you to identify the OLAP cube you wish to base your OLAP report on.
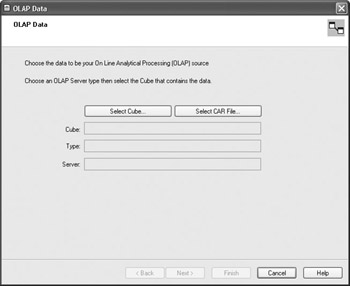
Click the Select Cube button to display the Crystal OLAP Connection Browser, where you can choose from the OLAP cube connections available. If you wish to report on a Crystal Analysis Professional .CAR file, you can click the CAR button; CAR files are found through the standard Open dialog, rather than the OLAP Connection Browser used for most OLAP connections.
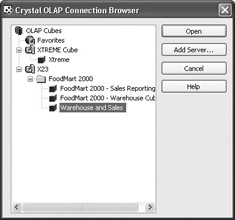
Use the OLAP cubes explorer tree to navigate to the OLAP cube you want to report on, then select it and click the Open button, or simply double-click the OLAP cube. If you don t see the desired OLAP cube, you may need to click the Add Server button to browse, log on to, and add a new OLAP server in the New Server dialog.
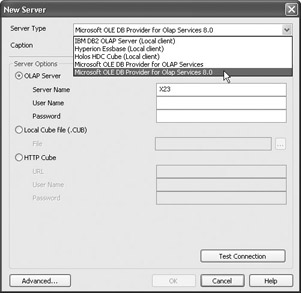
Depending on the type of cube and location of the OLAP database, complete the fields in the Add Server dialog box. If you are using a Microsoft Analysis Services cube with SQL Server 2000, choose the Microsoft OLE DB Provider for Olap Services 8.0 server type. If you are using Microsoft OLAP Services with SQL Server 7, choose the Microsoft OLE DB Provider for OLAP Services item. In either case, you ll then need to specify the server name, user ID, and password in the following three fields. If you have been provided with an Analysis Services local cube (.CUB) file, select the Local Cube file radio button and type in or navigate to the .CUB file. Or, if you ve been instructed to connect to the Analysis Services server via HTTP (the standard Internet protocol), select the HTTP Cube radio button and type in the URL to the server, along with your user name and password.
If you choose other OLAP Server Types, appropriate options will appear in the New Server dialog box for connecting to the associated cube. If you are unsure of how to connect to your particular cube type, consult with the administrator of your OLAP database.
| Tip | If your OLAP server doesn t appear in the Server Type drop-down list, you may need to install client software specific to your particular OLAP system, such as a cube-viewing application, on your PC. After you install this software, restart Crystal Reports and try creating the report again. |
Once you ve successfully logged onto and connected to the proper cube, you ll be returned to the OLAP Connection Browser and the cube will appear in the OLAP Cubes list ”you won t have to go through the Add Server process again, as the cube will remain in the list from this point on. If you made errors in the connection process in the New Server dialog box and the cube can t be connected to, right-click the cube definition in the list and choose Remove Server from the list. The server will be removed and you can click the Add Server button to add the server again (you can also rename the server from this pop-up menu, as well as adding individual cubes within the server to the Favorites entry in the browser).
Once you ve selected the desired cube in the OLAP Connection Browser, the Data dialog of the Report Creation Wizard redisplays, and the Cube, Type, and Server fields on the Data tab of the Expert will be filled in.
After you make these choices, click the Next button to show the Rows/Columns section, shown in Figure 19-2, to choose the dimension or dimensions you want to include in the rows and columns of your report.
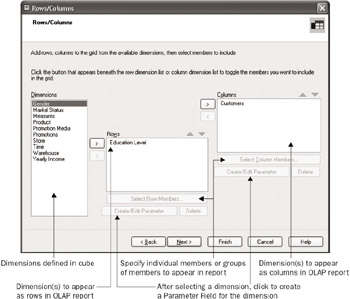
Figure 19-2: The OLAP Report Creation Wizard Rows/Columns section
| Note | Crystal Reports 10 includes a sample Holos OLAP cube for the Xtreme Mountain Bike company that you can use to experiment with OLAP reporting. XTREME.HDC can be found below the Crystal Reports program directory in \Samples\en\Databases\Olap Data. However, the examples in this chapter are based on the sample Foodmart OLAP cube provided with Microsoft SQL Server Analysis Services. |
If the default dimensions already in the Rows and Columns list aren t correct, choose from the Dimensions list the dimension that you want to appear as the row in your OLAP report. Then, simply drag and drop it into the Rows box or click the right arrow next to the Rows box.
Use the same drag-and-drop method to add to the Columns box the dimension you want to appear as the column in your OLAP report. Or, select a dimension and click the right arrow next to the Rows or Columns list.
You aren t limited to placing just one dimension in the Rows and Columns boxes. If you add multiple dimensions, Crystal Reports will group the dimensions in the OLAP report. For example, if you add a State dimension, followed by a Customer dimension, Crystal Reports will print states and show customers broken down within each state. If you place the dimensions in the Rows or Columns box in the wrong order, you can simply drag and drop the dimensions into the correct order within the Rows or Columns box. Alternatively, you can select the dimension you want to move, and use the up and down arrows above the Rows and Columns boxes.
If you wish to remove a dimension from the Rows or Columns box, drag the dimension back to the Dimensions list. Or, you can select the desired dimension and click the left arrow (you won t be allowed to leave a row or column empty).
Depending on the cube you choose for your report, you may find dimensions that contain many levels or members. A member (sometimes referred to as a generation) is a lower level of information that breaks down the higher level above it. For example, a Products dimension could contain several members : product type, product name within product type, and size within product name. Each member further breaks down the information shown by the member above it, creating a hierarchy for data in the dimension.
By default, if the dimension you choose for your OLAP report contains multiple members, Crystal Reports will show only the highest member in a group hierarchy when it displays the dimension. While this may be the way you want the report to appear, it may actually display a data level that is too high. Often, you ll add dimensions to a report s Rows and Columns boxes, only to have the OLAP report show just one number at the intersection of one row and column. If you need to increase the number of members shown inside a dimension that appears on the report, you can use the Select Members buttons to select the additional members that you want to see. First select the dimension in the Rows or Columns list that you wish to work with and then click the Select Row Members or Select Column Members button. You may also just double-click a dimension in the list. When you do either, the Member Selector will appear, as shown in Figure 19-3.
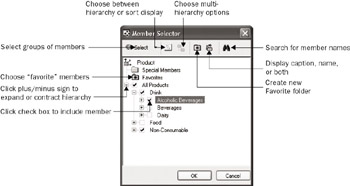
Figure 19-3: The Member Selector
The Member Selector dialog box shows the dimension members in a hierarchy, with pluses and minuses to the left, much like the display of folders and files in Windows Explorer. You can expand the hierarchy to see lower members by clicking the plus signs next to the members. If you want to see just the higher-level members, click the minus sign to collapse them.
Once you ve expanded the dimension s members sufficiently, you can simply click the check box next to individual members to select or deselect them. Those that are checked will be included in the report ”those that aren t won t. If you want to select multiple members at the same time, you may CTRL-click or SHIFT-click on multiple member names to highlight them (multi-select or range-select respectively), and then click one check box. All the members that are highlighted will be selected.
If you want to be more systematic in member selection, particularly for very large hierarchies, click the down arrow attached to the Select button in the Member Selector s toolbar to display a pull-down menu (you can also right-click a member name to get a similar set of choices). You ll see various options for selecting groups of members (such as all, none, all members at a certain level, and so forth). Notice that once you choose one of the options in the select menu, the Select button will display an icon similar to the choice you made from the menu. By just clicking the Select button, you can repeat that selection without displaying the menu again.
You can also control other aspects of the Member Selector by choosing other toolbar buttons:
-
Select Display Mode will change from viewing members in a hierarchy to sorting them in ascending or descending order.
-
Select Hierarchy will provide additional options if the particular dimension you ve chosen encompasses more than one hierarchy.
-
New Favorite Group will add an additional category underneath the Favorites folder where you may drag favorite members.
-
Display Members Using chooses between displaying dimension captions, names, or both (if your cube makes a distinction).
-
Search (new in version 10) displays a dialog box to allow you to search for members using text searches. You can either use a simple search or click the Advanced tab to create a more complex Boolean search. When the search is complete, you can search again from the resulting list of members, add the selected members to those already selected, or replace selected members with this list.
After you choose the members you want included in the report, click OK. You won t notice any difference in the Rows/Columns tab ”you ll need to double-click the dimension or click the Select Member button again to see what members you ve chosen.
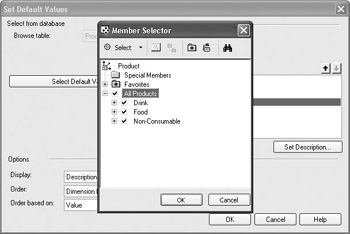
A new feature of Crystal Reports 10 is the ability to create a parameter field to allow the viewer to choose members to include in the OLAP grid whenever the report is refreshed. Click either the row or column dimension you wish to parameterize and click the Create/Edit Parameter button. The Create Parameter Field dialog box will appear. Steps for creating an OLAP parameter are similar to those for a regular report parameter, except that you must set default values before you save the parameter field. When you click the Default Values button, a limited version of the regular Set Default Values dialog box will appear. Within this dialog box, clicking Select Default Values will again display the Member Selector, where you can choose members to add to the parameter s pick list.
| Note | More information on parameter field creation is available in Chapter 14, Viewer Interaction with Parameter Fields. |
Once you ve chosen dimensions and members, click the Next button to advance to the Slice/Page section, shown in Figure 19-4, to determine how the remaining dimensions included in the cube will affect your OLAP report.
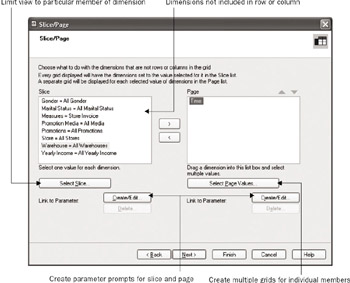
Figure 19-4: The Slice/Page section
In the Slice/Page section, you ll see all the other dimensions in the cube that you didn t include in the Rows or Columns boxes. You can use these dimensions to either slice or page your OLAP report. Slicing (similar to filtering) the OLAP report limits the report to certain occurrences of data in these dimensions. Paging the OLAP report is very similar to setting up report grouping. Like the grouping of other reports, discussed in Chapter 3, this creates a new section of the OLAP report showing a different OLAP grid every time the value of the chosen dimension changes. Each resulting OLAP report section will contain data just for that one member.
To slice the report according to a dimension, look at the Slice part of the dialog box. You ll notice that each dimension displays a filter criterion, such as Store = All Stores. Typically, this default value will be either All or a particular general value that was set as the default when the OLAP cube was defined. Either double-click the dimension you want to slice, or select the dimension and click the Select Slice button. The Member Selector dialog box, described earlier, will appear, in which you can choose a particular value to limit the OLAP report. After you make your choice and click OK, the criterion in the Filter list will change to indicate the value you picked. The OLAP report will now be limited to only values that are included in the dimension you chose.
| Tip | Unlike in the previous example with the Member Selector dialog box, you can choose only one value in the box here. Selecting a new value deselects the preceding value. |
To page the OLAP report according to a dimension, select the desired dimension in the Slice list and either drag it to the Page list or click the right arrow. Once again, the Member Selector dialog box appears, in which you can again select any combination of members (using options from the Select menus , if you d like). After you make your choices, click OK to close the Member Selector dialog box. The dimension you chose for paging will appear in the Page list at the right of the Slice/Page section. If you wish to later change the members you chose to page the report, return to the Slice/Page section and double-click the dimension in the Page list, or select the dimension and click the Select Page Values button.
You can add more than one dimension to the Page list. If you do so, you can change the order in which Crystal Reports will group the OLAP report, by selecting one of the dimensions and clicking the up or down arrow. If you want to remove one of the Page dimensions, select it in the Page list and click the left arrow button or drag the dimension back to the Slice list.
As with the previous section of the wizard, you can base pages on parameter fields. To do this, select the slice or page dimension that you want to create a parameter field for and click the Create/Edit button. The Create Parameter Field dialog box will appear, where you may choose options to prompt the report viewer when the OLAP report is refreshed. Then, the value that the viewer supplies to the parameter field will be passed to the slice or page dimension to control how the OLAP report appears. Once you ve added a parameter to a dimension, you ll notice the parameter field to the right of the equal sign in the Slice or Page list. If you later want to edit the parameter field, click the desired dimension and then the Create/Edit button. To delete the parameter and return to a fixed value or values chosen in the Member Selector, choose the desired dimension and click the Delete button.
Once you ve made any slicing and paging choices, you re ready to display the OLAP report if you re satisfied with the default formatting Crystal Reports will apply. Click the Finish button if you re ready to view the report. However, you have additional choices in the OLAP Report Creation Wizard if you wish to choose them. You may choose from a set of preformatted styles for the OLAP report, as well as adding charts to show data plotted in your OLAP report.
To customize the formatting of the OLAP grid objects the Wizard will create (very similar to the cross-tab object discussed in Chapter 11), click Next to display the Style section of the Wizard. Choose from one of the predefined grid styles to apply to the OLAP report.
You may then click the Finish button to display the report, or click Next to create a chart based on your OLAP data. There is a minimal set of charting choices on this section (more detail on charting on OLAP grids is discussed in Chapter 12).
Click the Finish button in the OLAP Report Creation Wizard to run the report and show it in the Preview tab. Depending on any page dimensions you chose, you ll see a few simple objects on the report, such as the print date and the report title. You ll also see one or more OLAP grid objects, plus any report sections and groups that were created to accommodate the page dimensions.
If you need to make changes to the Rows/Columns or Slice/Page values in the OLAP cube, you can rerun the Report Creation Wizard by clicking the OLAP Design Wizard button in the Expert toolbar or by choosing Report OLAP Design Wizard from the pull-down menus.
Alternatively, to display the full OLAP Expert with all possible options (discussed in the next section, Adding an OLAP Grid to an Existing Report ), you can select the OLAP grid object by clicking in the blank area of the object s upper-left corner (if there is more than one, select the particular one you want to change). Then, right-click and select OLAP grid Expert from the pop-up menu.
EAN: N/A
Pages: 223