An Example from Engineering Design
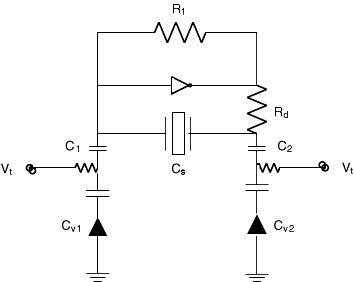
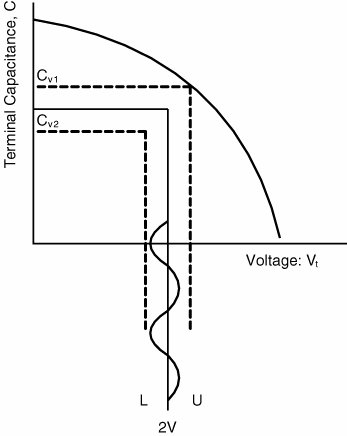
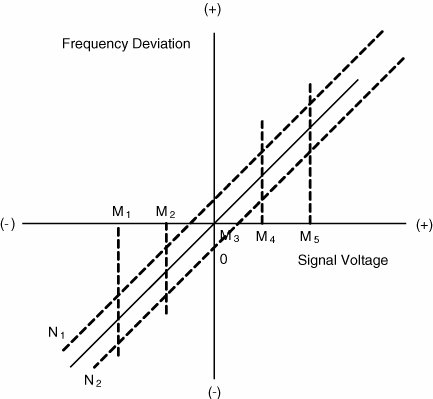
| Although our interest here is software design, a simpler yet realistic example from electrical circuit design may be very helpful in giving you insight into Taguchi Methods. This application shows the trade-off potential between the three stages of Taguchi design and also gives you insight into the increasing replacement of electronic circuits by software algorithms. Analog filters for radio and other signal processing have long since been replaced by digital (software-programmed) filters. Modern communication receivers are simply computer programs that tune to and receive signals on a chip-based computer. Similarly, the most advanced radio transmitters are computers that, rather than computing a number, prepare and transmit a signal at a chosen or preprogrammed frequency. As an example, we take a case study from the literature by Kanemoto.[4] Much of electrical circuit design involves adjusting part values and their tolerances to achieve a target performance over a certain range with the minimum number of parts and the least constraint on part tolerances. Normally, electronic components have tolerance values of plus or minus 20%. High-quality parts with a 10% tolerance are very expensive. Parts having 1% tolerance are even more expensive and usually are reserved for laboratory or standards use. Figure 17.3a shows a simple frequency-modulated oscillator consisting of an inverter, a piezoelectric crystal, two resistors, two capacitors, and two voltage-dependent variable capacitors. Figure 17.3b shows the voltage variation resulting from a modulation signal V around a 2V dc bias value. Figure 17.3c shows the frequency deviation resulting from the signal voltage. Clearly the performance value of this circuit is to maintain a relationship between frequency deviation (output) and a varying signal voltage (input). This performance target can be disturbed by noise factors such as environmental temperature, time drift, and power fluctuation, but the latter is the principal noise factor, ranging from + or -0.5V. When designing an electronic circuit, it is simple enough to bench-test it to determine variation around the target value of zero deviation from a center frequency of 453.286 kHz for an input signal voltage of 0. In this case, you can do a full factorial study since there are so few parameters. Figure 17.3A. Frequency-Modulated Oscillator: The Experimental Circuit Figure 17.3B. Voltage Variation Figure 17.3C. Frequency Deviation The experiments with Kanemoto's circuit showed an error variation of 12.763 Hz and an error variance of 1596. The control factors and their levels are shown in Table 17.2, in which power source voltage is the voltage input to the inverter. This data is put into an orthogonal array to carry out the statistical experiment. The results are shown in Table 17.3. It gives the SNR and sensitivity values for the original configuration, the optimal configuration, and the improvement or gain, along with the results of the follow-up confirmatory experiment. The factors for the original circuit are A1B2C2D2E2F2H2that is, the first crystal choice, a CSB-455 in column 1 of the factor table and the second or column 2 choice for all the other factors. The optimal circuit given these factors and the single noise factor of the small power supply voltage instability is A2B3C3D3E3F2G2H3. This would be the circuit with the second crystal choice, a B456-F15, R1 = 1 kOhm, Rd = 5.6 kOhms, C2 = C1 = 820 mfd, and both capacitors of chip type, and the bias on the inverter set at 7 volts. This is a rather simple problem, but it does show Taguchi Methods favorably. You can vary all the factors at once to optimize the circuit in one statistical experiment and its confirmation, rather than fiddling at the designer's bench for days or doing hundreds of circuit simulations, changing one part value at a time.
| ||||||||||||||||||||||||||||||||||||||||||||||||||||||||||||||||||||||
EAN: 2147483647
Pages: 394