Sampling Theory
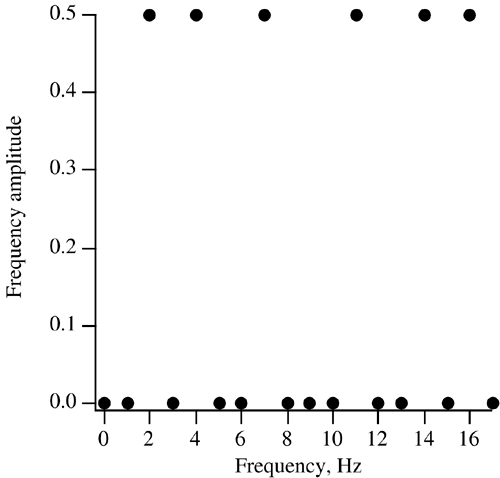
| DFTs are based on a finite number of samples taken of an input signal, but who is to say what the sampling rate should be? If you don't take enough samples, the signal won't be properly characterized. If you take more samples than you need, you will waste computer resources. Fortunately, there is something called sampling theory to help resolve this issue. What sampling rate to use depends on whether or not a signal is bandwidth limited. A bandwidth-limited signal is one that has no spectral components beyond a certain frequency. An example of a bandwidth-limited signal would be one that was passed through an amplifier with a finite frequency response. According to the sampling theory, a bandwidth-limited signal with a maximum frequency of B can be reconstructed without error from samples taken at the Nyquist frequency, shown in Eq. (22.21). Equation 22.21 For a sine or cosine function, the Nyquist sampling frequency corresponds to taking a sample at each peak and trough of the function. One way to think of the Nyquist frequency is that it is the minimum sampling rate that should be used to properly sample a bandwidth-limited signal. A signal sampled at less than Nyquist sampling frequency is said to be undersampled. If the sampling rate is greater than the Nyquist frequency, the signal is oversampled. Another way to look at the Nyquist sampling frequency is to reverse-engineer the problem. Let's say you are going to take N samples per second for a given signal. The maximum signal frequency that can be correctly modeled by the resulting Fourier transform is given by Eq. (22.22). Equation 22.22 For example, if you are taking 64 samples per second for a given signal, the maximum frequency component of the signal should be less than or equal to 32 Hz. The quantity f max is also referred to as the Nyquist critical frequency. A problem arises if there are any components to the input signal that are above the Nyquist critical frequency for the chosen sampling rate. When a Fourier transform is performed on such a signal, all of the power spectral density that lies outside of the sampling frequency is spuriously moved into the frequency range. This is a phenomenon known as aliasing , and can make properly interpreting a frequency spectrum a difficult task. One way to prevent aliasing is to pass the signal though an analog signal filter that will low-pass the signal below some upper cutoff frequency, f h . Naturally, this upper cutoff frequency must be higher than any signal frequency of interest. You then set the sampling rate to be at least twice the upper cutoff frequency of the filter used, f N > 2 f h . Sampling at a rate roughly five times the upper cutoff frequency of the low-pass filter is a good rule of thumb. To see the effects of aliasing, let us revisit the composite cosine function we looked at in the previous section. The maximum frequency in the composite signal was 16 Hz. This corresponds to a Nyquist minimum sampling rate of 32 samples per second. When we analyzed the signal in the previous section, we used a sampling rate of 64 samples per second so everything was fine. But what happens if we use a sampling rate of 18 samples per second instead? To do this, modify the TestComplex.java program by replacing the line int N = 64; with the line int N = 18; . The results of this change are shown in Figure 22.5. Instead of peaks at 4, 7, and 16 Hz, there are peaks at 2, 4, and 7 Hz. Because the 16 Hz component of the signal was beyond the Nyquist critical frequency for this case (9 Hz), its frequency amplitude peak has been aliased into the 2 Hz location. Figure 22.5. Effect of signal aliasing |
EAN: 2147483647
Pages: 281

