The difference between quality assurance and quality control
|

|
These are closely related but different. Assurance is primarily about the means by which the project expects to reach its quality requirements, and also about inspiring confidence in key stakeholders that they too can expect the project to do so. Control, on the other hand, is primarily about measuring and testing that those requirements are actually being reached, and interpreting such test and measurement results where quality is not as intended in order to determine the causes and thereby help to identify what can be done to fix quality. IBM describes the difference in the following way: 'Quality assurance focuses on process control and defect prevention activities. Quality control focuses on defect detection and correction activities'[5]. Quality assurance
There are two distinct aspects to quality assurance. One is making sure that quality objectives are met; the other is about giving stakeholders confidence that they will be met. It is possible, but a bad idea, to fail to meet the quality objectives while inspiring confidence that they will be met that would be nothing more than an old-fashioned confidence trick. Enron[6] became infamous for its skill in this mistaken use of quality assurance. A more honest kind of problem is where the project is meeting quality standards but key stakeholders do not recognize that to be the case. In such a situation, raising quality is not the answer, but communicating the quality that has already been achieved is. So key questions in quality assurance are:
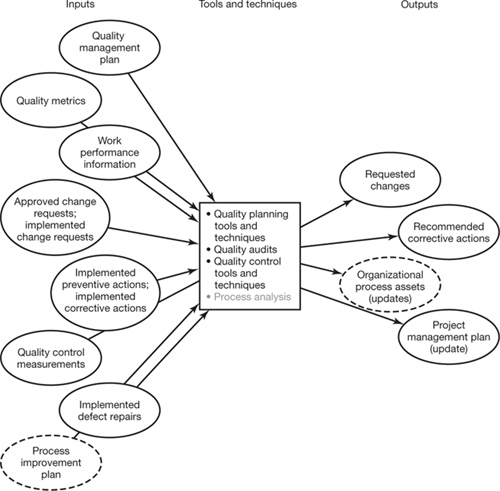
The 'How do we know?' and 'Are they confident?' questions, above, can be answered in terms of what processes are in place. This is the PMBOK approach, but not every organization or industry is suited to process-heavy thinking, and there are other ways to answer these questions than in terms of processes. For example, simple measurements and long-run histories of actual results may suffice. The quality assurance processFigure 8.2 shows the quality assurance process and lists its inputs, tools and techniques, and outputs. Remember that there are two different but related aims in quality assurance: making sure that quality objectives are met, and giving stakeholders confidence that they will be met. The most important outputs of the quality assurance process from the point of view of making sure that quality objectives are met are the requested changes and the recommended corrective actions, as these are things that will improve quality. The project plan should also be updated as necessary as a result of the quality assurance process. These outputs can also serve the second aim of quality assurance, giving stakeholders confidence that quality objectives are being or will be met, but sometimes it is quickest and most effective simply to write a report entitled 'QA Report' or similar as an output aimed at this second end. An example of such a report is shown here.
Figure 8.2. The quality assurance processAdapted from PMBOK Guide (p.188)
The quality audit is the main tool or technique in quality assurance, besides the quality planning ones, which will have been identified and put in place previously, in quality planning. The idea of an audit is simple, and it can be done very simply, but in real life the word 'audit' can have very negative connotations, and in some organizations the only way to get an audit of any kind quality or other done is to use some other word and pretend that it has nothing to do with auditing. The 'ISO says' box gives formal definitions to quality auditing and associated terms; do not worry too much about the qualifier 'independent' in the definition of 'quality audit'. There are degrees of independence from the project, the aim is not to achieve some mythical status of the remotest possible independence in your quality audit, but to achieve whatever degree of independence from you and the rest of the project team is enough to provide either useful information to you as the project manager and to the sponsor, to enable you to manage quality well, or, on the other hand, to be credible to stakeholders as being an objective view of things. Which of these should be the primary consideration will depend on which of the two related but different aims of quality assurance is more important at the time. Either way, the audit needs audit criteria, and these should normally be the quality objectives, which you will have recorded in the plan. Remember, as we said in the section above on planning, you will probably not have to do or worry about most of this yourself as project manager: in most organizations of any size there will be a quality management staff who either can advise the project on quality management matters, or may even be able to take on responsibility for quality management. If so, the task of running quality audits is exactly the kind of thing in which they can be most valuable to the project.
The most important output from the quality assurance process from the project's point of view is a request to change something, because that is how quality problems, indeed all problems, get fixed in a controlled way. Note that the output is a change request, not an actual change, because it should go into the change control process for the project rather than being implemented immediately. Is this bureaucratic? No, it should not be. To implement the change directly and bypass the project's change control process would be to create uncontrolled change, which means increasing risks. The project plan may also need to be updated to reflect the change recommended by the quality assurance process, and this is another output. Although it may not be important from the short-term view of the project, the organization in which the project sits is likely to value the lessons inherent in the recommended changes, which is another output. Quality controlAs is the case for quality assurance, the requirements for quality control will be set out in the project quality plan. Quality control boils down to two questions:
Figure 8.3 shows the inputs, tools and techniques, and outputs for the quality control process. The quality plan and the quality metrics specified in it are of course key inputs to quality control: we have to know what we are to measure and how that fits in to what we want to achieve in quality. The quality checklists and our old friend 'organizational process assets' may also be inputs. If the project has reached that stage yet, then deliverables of course are key inputs, and in any case, information about how the project work is being performed will be an input. Approved change requests need to be inputs to ensure that the quality control process is operating on the project's performance as it actually is, rather than on an out-of-date picture of things.
Figure 8.3. The quality control process* The PMBOK lists the tool 'Cause and effect diagram'.The most important thing in quality control is to know the effect and how to change it, whether in diagram form or not. It will usually be extremely helpful to know the cause too, although this is secondary to being able to control the effect and is valuable only insofar as is a means to this. Inspection is a means to the end of understanding cause and effect, and all the other tools and techniques listed here are essentially no more than specialized variants for understanding cause and effect.
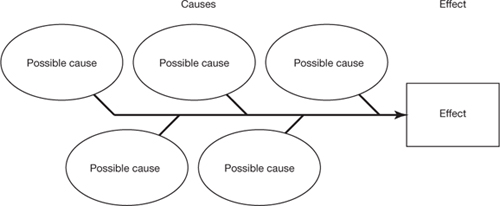
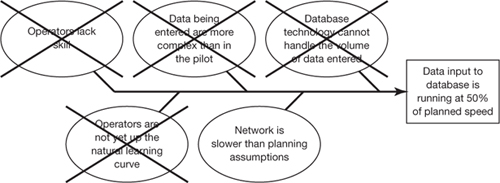
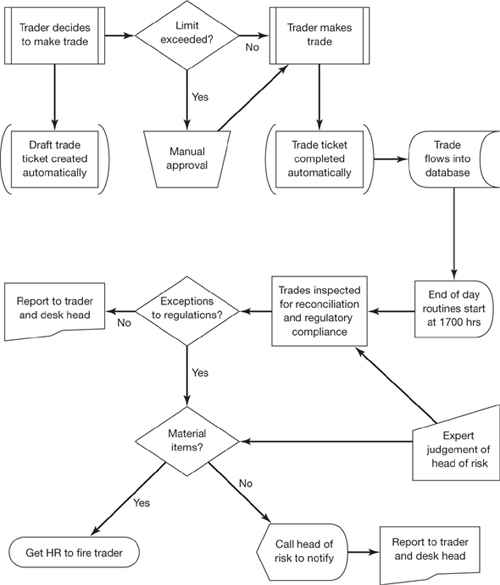
As the narrative in Figure 8.3 says, the whole point of quality control is to validate the deliverables. The tools used in quality control all have this as their ultimate aim, which boils down to measuring various attributes of quality, and where these fall short of what is required, to gain an understanding of the cause and effect behind this state of affairs so that the project can correct things and achieve the planned level of quality. Most of the tools and techniques listed in Figure 8.3 are primarily statistical and implicitly assume that the project is an engineering one where there is a wealth of data waiting to be captured. An ideal scenario for these tools is a project in a widget manufacturing company, with machines spewing out widgets, sprockets and furtwanglers by the million, each with dimensions that can be measured quantitatively. If this is the case, and it often is in project management, then quality control should use statistical techniques in their fullest form. However, there are many projects where quality is important but is more qualitative. The retail experience felt by customers in new shops or on online websites, the emotional intensity of an advertisement, the similarity of a film sequel to the first film in the series, and the value to new hires of a graduate training programme are examples of other things that projects can be set up to achieve, but which are not, at first glance, as amenable to quantitative analysis as our widget manufacturing plant. However, if you understand the principles behind the statistical tools, you will find that the principles are just as applicable to these softer kinds of projects. Figure 8.4 explains what a cause and effect diagram is and gives an example. This is a one of the most useful presentational tools in quality control, although of course it is not an analytical tool. An analytical QA tool that is not statistical is the flowchart. Figure 8.5 gives the standard symbology conventions for use in drawing flowcharts and Figure 8.6 illustrates their use with an example.
Figure 8.4. Cause and effect diagram (also known as a fishbone diagram), with exampleExample of a cause and effect diagram, as initially drawn
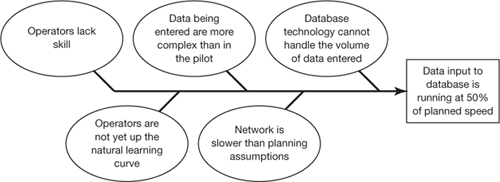
The cause and effect diagram is a simple drawing. Begin by listing the possible causes. it is a useful communication tool for use in getting a consensus on what the possible causes might be. Ensure that there is also consensus on what the exact problem or effect that is to be understood is, and how it is best described make sure you are answering the right question. Cause and effect diagram after it has helped to understand root cause
Once you have consensus on the possible causes, obtain data to understand which are the most significant causes of the effect. This example is a simple case, in which there is only one cause. Often, however, the situation is complicated by there being several causes which interact.
Figure 8.5. Formal symbology conventions for use in flowcharts
Figure 8.6. Example of a flowchart, with formal symbolsThis slightly fanciful hypothetical example of a flowchart which uses formal symbols gives a high-level description of part of the process in securities trading in an imaginary investment bank, which might be part of a project to improve risk management. From a quality control point of view, it helps us to identify which parts of the process are associated with quality problems, or, if that is not yet clear, which parts of the process are and which are not understood, so that we can clarify our understanding where it is not clear, and probably thereby find the problem area. This example also illustrates one of the main drawbacks of flowcharts, which is that they can be messy and unless drawn carefully and using implicit conventions carefully (e.g. how much detail, whether to list all inputs) they may be too vague to help understand the QA problem much.
The analytical tools necessary for quality control are mainly statistical, and require a sound grasp of basic probability and statistics (to A-level in UK terms), including concepts such as the following:
Textbooks on project management tend to either ignore these statistical techniques entirely, or to give the impression that they are indispensable to project management. There is no shame in being intimidated as a project manager by some of the dry expositions of various statistical techniques on offer within the subject. The purpose of these techniques in quality control on project management is basically to help you understand what level of quality is being attained, and if there is a quality shortfall, to help decide what to do about it. If you are familiar with the necessary statistical theory, great. If not, there is probably not much point trying to pick up bits and pieces of statistical knowledge in a hurry. If you want to learn, an easy way is to confine yourself to what a spreadsheet program such as Microsoft Excel or Lotus 1-2-3 can do, and set yourself a goal of learning one new statistical function every day, or every week. Even more than skill in performing the calculations, it is important that you understand the principles behind them, especially what kind of question each technique can answer and its limitations. This book does not attempt to be a textbook on statistics, but as an example of the kind of thing you need to know in regard to the principles and limitations in statistical techniques, consider the mean and standard deviation. You need to know the following in order to be able to apply this tool to quality control:
We will describe one more tool from the PMBOK's list before closing this section on the tools of quality control, and that is control charts. We describe it for two reasons. First, it features prominently in the PMI's exams, but secondly and more interestingly from the point of view of the practising project manager, the ideas behind it, if not the tool itself, are highly valuable in quality control and in general in thinking about project management. Control charts and the statistical concept of controlThe common sense idea of control is all that we need to understand the advanced statistical concepts of control, and it is also, for sound common sense reasons, fundamental to quality control and more generally to quality management in project management. 'Is this project under control?' is the first thing that top management will want to know should a project that one of their subordinates is sponsoring be brought to their attention. There is an obvious difference between a project which is doing badly but which is nonetheless under control, and one which is doing badly and is out of control. Out of control projects often get cancelled, because they need to be to protect the rest of the organization. An out of control project can bring down not just companies, but governments too. Given its significance in plain old common sense thinking, it is not surprising that control has been identified as a vital factor in the health of projects[7].
We may define a project as being in control (Figure 8.7) if all of the following conditions are met:
Figure 8.7. Example of a control chart, of a process in control
The idea of control can be refined in many projects to a point where measurement of some attribute of a deliverable or a process will indicate objectively whether the deliverable or process is in control. In a 10-year project to build a new aircraft, if the actual costs exceed the estimated costs every single month, then we would have little difficulty in saying that costs were out of control, for example. We can extend the idea illustrated in that example by using a few elementary statistical tools to build a control chart. Figure 8.8(a) is an example of a control chart 'in control'.
Figure 8.8. Control charts: (a) in control; (b) two ways to be out of control
The purpose of a control chart is to give a graphical representation showing whether or not a process or set of deliverables is in control. There are two indicators of being out of control; both are described above. Where do the upper and lower control limits come from? These are defined either arbitrarily, for example a company may decide that for project costs, a variance of 10% is acceptable, and anything in excess is out of control, or by some statistical formula, for example by defining anything beyond five sigma or six sigma (five or six times the standard deviation) as being out of control. Note that some other term than 'out of control' may be used, for example 'unacceptable' or 'to be escalated' but for the purposes of quality control the operative concept is that of control. Why are seven consecutive points on the same side of the mean taken as an indicator of being out of control? Seven points is a convention, but it is based on the idea that we should normally expect measurements to fluctuate around the mean in a random walk, and seven consecutive points on one side suggests that there is a significant non-random factor present. Much of the time it is reasonable to take seven points as an indicator of a control problem (the PMI exams require you to know this). However, there may be cases where this rule of thumb can be changed, for example to consider only a run of data points on one side of the mean, or some number less than seven[8]. Figure 8.8(b) shows two ways to be 'out of control'. The two main outputs from the quality control process are quality control measurements and, where relevant, validated defect repairs. Updates to the baselines and recommendations for preventive and corrective actions and for changes and defect repairs may also be important outputs, depending on the nature of the project. The full set of possible outputs is given in Figure 8.3. |
 In this diagram we have shown only one output in a solid-lined oval, meaning that the others are less important. Many of the other nine outputs are usually very important in quality control, especially quality control measurements and validated defect repairs. The vital point to understand as a project manager, however, is that the whole point of quality control is to validate the deliverables of the project, and it is for this reason that we identify that output as chief of all the 10 outputs in this diagram. Keep that in mind and you will avoid getting bogged down in the details of quality control, important as they often are. Adapted from
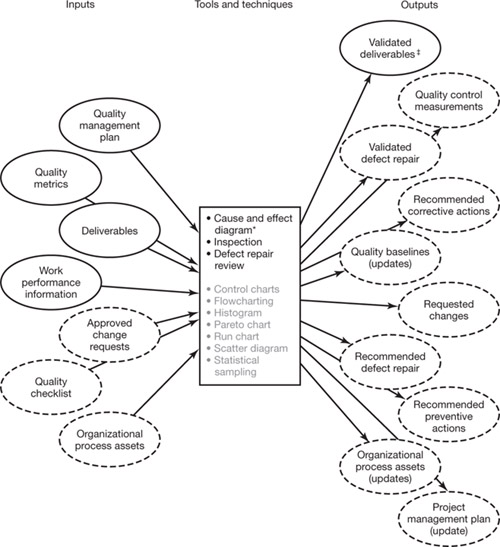
|
Top of Page