5 - Surgical Anatomy of the Lungs
Editors: Shields, Thomas W.; LoCicero, Joseph; Ponn, Ronald B.; Rusch, Valerie W.
Title: General Thoracic Surgery, 6th Edition
Copyright 2005 Lippincott Williams & Wilkins
> Table of Contents > Volume I - The Lung, Pleura, Diaphragm, and Chest Wall > Section II - Physiology of the Lungs > Chapter 7 - Pulmonary Gas Exchange
Chapter 7
Pulmonary Gas Exchange
Joan Gumowitz Matthews
OVERVIEW OF GAS EXCHANGE
At the cellular level, and in very simple organisms, oxygen is provided by simple diffusion. In more complex organisms, a more complex delivery system is necessary. The human respiratory system supplies oxygen through the combined processes of convection (bulk flow) and diffusion. The muscles of the chest wall and the conducting airways bring large volumes of gas into the alveolar space. The alveolar surface, on the order of 50 to 100 square meters, provides a large area for diffusion of gas into the blood. The cardiovascular system conveys blood to the tissues, where the large combined capillary surface area facilitates diffusion of oxygen across the cell membrane and into the mitochondria. The net effect is the passive diffusion of oxygen down a partial pressure gradient from the atmosphere to mitochondria (Fig. 7-1).
Organisms also require a mechanism to eliminate the end products of metabolism. The renal and gastrointestinal systems perform this function for liquid and solid wastes, whereas the respiratory system is the site of elimination for carbon dioxide gas. The term gas exchange thus refers to both the uptake of oxygen and the elimination of carbon dioxide.
Oxygen consumption and carbon dioxide production occur in the mitochondria and vary with the metabolic state. At rest, both are on the order of 200 to 250 mL/min, but this can increase to 1 L/min with brisk walking and 3 L/min with running. Although trained athletes commonly achieve consumptions of 5 L/min, Clark and associates (1983) have documented transient mean oxygen consumption levels as high as 6.6 L/min in a select group of rowers.
The relative amount of carbon dioxide and oxygen exchanged is determined by the type of fuel consumed. Carbohydrate metabolism generates 1 mole of carbon dioxide for every mole of oxygen consumed. For proteins, the ratio drops to 0.8, and for fats it is 0.7. This ratio of total body carbon dioxide production to oxygen consumption is termed the metabolic respiratory quotient(RQ). In the lungs, the ratio of carbon dioxide elimination to oxygen uptake is called the respiratory exchange ratio(R). Because the lung is the site of all oxygen uptake and carbon dioxide removal in the body, lung gas exchange in the steady state is equal to tissue gas exchange, and R is equal to RQ.
PHYSICS OF GASES
Gas Phase
Both gases and liquids are fluids, a state of matter characterized by weak intermolecular forces and no fixed shape. Gases differ from liquids in that these forces are so weak that there is no fixed volume either. The ideal gas law relates the volume of a gas to the pressure, temperature, and number of moles:
![]()
where n is the number of moles, R is the universal gas constant, and T is in degrees Kelvin (degrees centigrade+273). At constant temperature, pressure and volume are inversely proportional (Charles' law), and at constant pressure, gas volume is directly proportional to temperature (Boyle's law). Thus, under standard conditions of 0 C and 1 atmosphere, 1 mole of an ideal gas occupies 22.4 liters (Avogadro's law).
Dilute gas mixtures, such as air, also obey the ideal gas law, with n being equal to the total number of moles and P being equal to the sum of the pressures that each individual gas would exert in the absence of the other gases (Dalton's law). Because the volume and temperature of all gases in a mixture are equal, it follows that the partial pressure of any gas is proportional to its mole fraction, Fx:
![]()
For oxygen at sea level, this becomes
![]()
Vapor Pressure
When a liquid is in equilibrium with its own vapor, the pressure of the gas phase is called the vapor pressure. This
P.94
is the pressure at which equal numbers of gas molecules are entering and escaping from the liquid surface. The vapor pressure of a liquid is solely determined by temperature and is unaffected by barometric pressure. At body temperature, 37 C, the vapor pressure for water is 47 mm Hg. If dry air at 760 mm Hg is inhaled into the upper airway and held at constant volume, the pressure would increase to 760 + 47 = 807 mm Hg. This creates a driving pressure for humidified gas to flow out. Because more water will evaporate to maintain the water vapor pressure at 47 mm Hg, the net effect is that only oxygen and nitrogen are expelled, in the same ratio as their mole fraction in air: 0.79 and 0.21, respectively. Thus, at equilibrium, the pressure in the upper airway is 713 + 47 = 760 mm Hg. The partial pressure of oxygen in this setting becomes
![]()
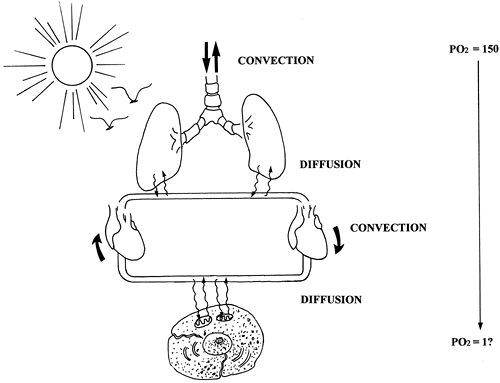 |
Fig. 7-1. Overview of gas exchange showing combined processes of convection and diffusion. The respiratory muscles cause convection, or bulk flow, of gas into the airways, while the cardiac system provides convection of blood to the tissues. Diffusion of gas occurs across both the alveolar and tissue capillary membranes. The end result is the passive diffusion of oxygen from the atmosphere (Po2 = 150 mm Hg) to mitochondria (Po2 on the order of 1 mm Hg). |
Environmental Conditions
Because the volume occupied by any given mass of gas is dependent on its temperature, pressure, and humidity, these conditions must be specified when using volume measurements to quantify oxygen and carbon dioxide. Three conditions are commonly specified:
STPD: standard temperature and pressure, dry
ATPS: ambient temperature and pressure, saturated
BTPS: body temperature and pressure, saturated
Oxygen and carbon dioxide volumes are expressed at STPD, whereas lung volumes and ventilation are expressed at BTPS or ATPS.
Boyle's and Charles' laws are used to convert gas volumes from one set of conditions to another:
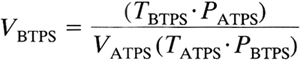
where T is in degrees Kelvin and P is equal to PB minus PH2O. In acid base physiology, carbon dioxide is expressed in moles rather than volumes, obviating the need for conversion.
Gas Dissolved in Liquid
When a gas and a liquid come in contact with each other, some of the gas molecules enter the liquid and form a solution. At equilibrium, the numbers of gas molecules entering and leaving the solution are equal. The quantity of a gas contained in solution at equilibrium is described by Henry's law:
![]()
where C is the concentration of gas in solution, P is the partial pressure in the gas phase, and is a solubility coefficient whose value depends on the specific gas and liquid, as well as the temperature. The for oxygen in blood at 38 C is 0.003 mL/mm Hg dL. Carbon dioxide is 20 times more soluble in blood than oxygen; the for carbon dioxide under the same conditions is 0.06 mL/mm Hg dL.
True solubility implies that the gas molecules have not formed any chemical bond with molecules in the liquid.
P.95
The quantities of oxygen and carbon dioxide that are carried in true solution are small compared with the amounts of these gases that react chemically with the blood. The capacitance coefficient, , includes both the gas carried in chemical combination as well as in true solution. Its value is dependent on additional variables, such as hemoglobin concentration.
Even when a gas-containing liquid is not in contact with the gas phase, we still refer to the partial pressure of the dissolved gas. Although a gas in solution does not exert an actual pressure in the liquid, the partial pressure of a gas in a liquid is taken to be the partial pressure of the gas phase with which it would be in equilibrium.
Diffusion
Diffusion is the net movement of particles due to random motion. Although diffusion is usually assumed to occur down a concentration gradient, it is more accurate to say that diffusion occurs from an area of high chemical activity to low activity. The chemical activity, or fugacity, of a gas in solution is best represented by its partial pressure. In the gas phase, partial pressure and concentration are linked in a predictable fashion. In the liquid phase, the relation between partial pressure and concentration is a function of the solubility coefficient. Diffusion of a gas between different liquids with different solubility coefficients always occurs along the partial pressure gradient, irrespective of the direction of the concentration gradient. In fact, in some instances, diffusion occurs against a concentration gradient (Fig. 7-2).
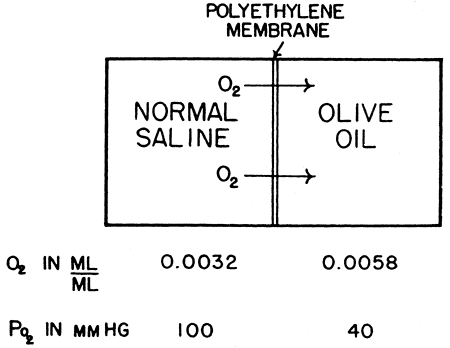 |
Fig. 7-2. Saline equilibrated with a Po2 of 100 mm Hg is placed on the other side of a polyethylene membrane from a solution of olive oil, equilibrated at a Po2 of 40 mm Hg. Although the concentration of dissolved oxygen is nearly twice as great in the olive oil, the oxygen will diffuse from the saline into it, against the concentration gradient. The diffusion takes place under the influence of the pressure gradient rather than the concentration gradient. From Fenn WO, Rahn H (eds): Handbook of Physiology: Respiration. Section 3, Vol. 1. Baltimore: Williams&Wilkins, 1964, p. 841. With permission. |
The rate of gas diffusion in the liquid phase is described by a modification of Fick's law:
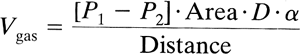
where the diffusion coefficient D of a gas is related to its molecular weight and the strength of its cohesive forces. In a liquid medium, the cohesive forces acting on a gas are increased, which makes the diffusion of oxygen in water much slower than in air (on the order of 10-5). Fick's law applied to diffusion across a membrane implies that diffusion is greatest for a highly soluble gas across a thin membrane with a large surface area.
FACTORS DETERMINING GAS EXCHANGE IN THE NORMAL LUNG
Atmospheric Gases
The composition of Earth's atmosphere is assumed to be constant at 79% nitrogen and 21% oxygen (dry), with a negligible amount of carbon dioxide present (0.03%). Atmospheric pressure varies according to altitude and meteorologic conditions. Changes due to weather are on the order of 0.5% and do not affect respiratory physiology. Much larger variations are seen with changes in altitude. At sea level the pressure is usually considered to be 760 mm Hg, whereas Denver, at an elevation of around 5,000 feet, has a barometric pressure of 625 mm Hg. A typical commercial airliner flies at an altitude of 29,000 feet (equivalent to the summit of Everest), where the pressure is approximately 230 mm Hg. At 33,000 feet, the pressure drops to 200 mm Hg and it is no longer possible to maintain a normal inspired Po2 while breathing 100% oxygen. At 63,000 feet, barometric pressure equals water vapor pressure, body fluids boil, and alveolar Po2 and Pco2 fall to zero.
Alveolar Gas
The partial pressure of gas in the alveolus represents a critical junction point in gas exchange. Because the mammalian respiratory system operates in a to-and-fro fashion, blood and tissue Po2 approach, but can never exceed, alveolar Po2. This is in contrast to the countercurrent flow design of the fish gill, where blood partial pressures approach inspired partial pressures.
Alveolar gas composition is the result of only four variable parameters: inspired gas composition, mixed venous gas composition, alveolar ventilation, and alveolar perfusion (Fig. 7-3). The alveolar partial pressure of a gas will lie somewhere between the inspired and mixed venous values for that gas. An increase in ventilation relative to perfusion will cause the alveolar gas composition to approach inspired, whereas an increase in perfusion relative to ventilation will cause the alveolar gas to approach mixed venous.
P.96
Note that alveolar gas composition is determined by ventilation and perfusion relative to one another (V/Q ratio) and not the absolute value of either. Figure 7-4 is an example of a Po2 Pco2 diagram showing all the possible combinations of alveolar Po2 and Pco2 as a function of V/Q for a given inspired and mixed venous gas value.
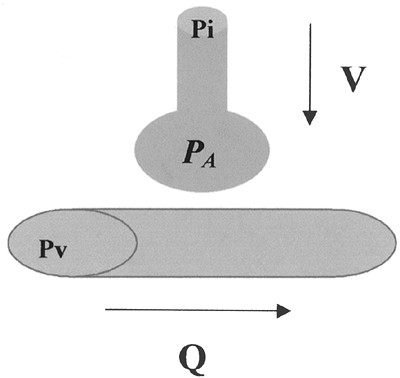 |
Fig. 7-3. Alveolar gas composition must lie somewhere between inspired and mixed venous. A relative increase in ventilation will drive the partial pressure of alveolar gas (PA) closer to the partial pressure of inspired gas (PI), whereas a relative increase in perfusion will drive PA closer to the partial pressure of mixed venous gas (Pv). |
Whereas all alveoli share the same inspired and mixed venous gas composition, perfusion and ventilation vary throughout the lung. In the normal lung, gravitational effects cause the V/Q to be higher at the apex than at the base. In certain disease states, the scatter of V/Q ratios is more pronounced. The efficiency of the lung as a gas exchanger is directly related to the uniformity of V/Q: A lung with all alveoli operating at the same V/Q is more efficient than a lung with V/Q mismatch. Note that the term mismatch does not imply that ventilation does not match perfusion, but rather that the V/Q ratio in one area of the lung does not match the V/Q ratio in another.
Although the nonuniformity of V/Q ratios makes it impossible to determine the gas composition of every alveolus, we can calculate the gas composition of a hypothetical ideal alveolus having the same V/Q as the lung as a whole. In this sense, we are considering the lung as a single alveolus. Any deviation from this model is evidence of nonhomogeneity of alveoli. If the V/Q ratio and mixed venous gas composition are known, then the ideal alveolar gas composition can be obtained graphically from a Po2 Pco2 diagram like the one in Fig. 7-4.
However, these diagrams are tedious to generate, and, in most clinical situations, the necessary information is not available. A simpler approach is to use the alveolar gas equation for oxygen:
![]()
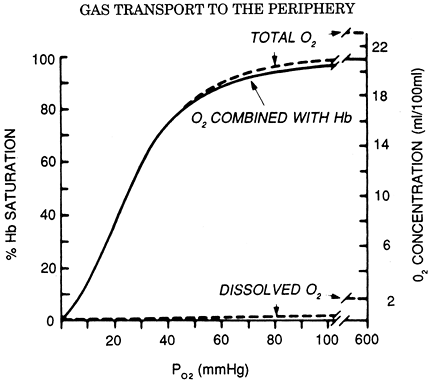 |
Fig. 7-4. Ventilation-perfusion ratio or VA/Q curve. This line represents all possible gas combinations that can prevail as a result of the equilibration of mixed venous blood with inspired gas. The ratios of ventilation to perfusion responsible for various gas tensions are indicated. These ratios range from o, representing the mixed venous blood gas tensions, to , representing the inspired gas tensions. From Fenn WO, Rahn H (eds): Handbook of Physiology: Respiration. Section 3, Vol. 1. Baltimore: Williams&Wilkins, 1964, p. 740. With permission. |
It derives from the observation that alveolar Po2 is equivalent to inspired Po2 (first term of equation) minus the volume of oxygen exchanged for carbon dioxide according to R (second term of equation). The third term of the equation accounts for the additional oxygen entrained when R is less than 1, and is usually ignored when dealing with room air. Because alveolar Pco2 is essentially equal to arterial Pco2, and assuming an R of 0.8, the alveolar gas equation for a patient breathing room air can be simplified to the following:
![]()
In an ideal homogeneous lung, the alveolar arterial Po2 difference is essentially zero. Thus, a large gradient between the calculated ideal alveolar Po2 and the measured arterial Po2 is an indication of nonuniformity in the lung.
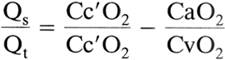
Diffusion Across the Alveolar Capillary Membrane
The alveolar capillary membrane is perfectly designed for diffusion, with a combined surface area somewhere between 50 and 100 square meters and a membrane thickness on the order of 0.005 mm. In the normal lung, alveolar and blood Po2 and Pco2 equilibrate within the first 0.25 second, or one-third of the way along the capillary. Gases like oxygen
P.97
and carbon dioxide, which reach equilibrium before exiting the capillary, are said to be perfusion limited. Their uptake is limited only by the amount of blood delivered to the alveolus. Pathological factors, such as loss of alveolar surface area, can cause a gas that is normally perfusion limited to become diffusion limited, resulting in incomplete equilibration at the end of the capillary. Some gases, such as carbon monoxide, are diffusion limited even under normal circumstances. This is due to the physical properties of the gas itself. Gases that have a low conductance through the membrane and a high solubility in blood equilibrate slowly. The membrane-to-blood solubility ratio is a good indicator of how quickly a gas will approach equilibrium: A higher value indicates more rapid equilibration. Most inert gases (i.e., those that do not combine chemically with the blood) have ratios close to unity and equilibrate rapidly. These include nitrogen, helium, and most anesthetic gases. Carbon monoxide has a membrane-to-blood solubility ratio of much less than 1; oxygen and carbon dioxide fall somewhere in between.
It is important to differentiate between rate of equilibration and rate of diffusion. Although most inert gases equilibrate rapidly, they have widely varying diffusion rates. Helium is virtually insoluble in blood, with an uptake of essentially zero. Because helium is confined to the gas phase, changes in helium concentration can be used to calculate lung volumes. The high blood solubilities of ether and methoxyflurane meant that significant quantities of these gases were taken up during anesthesia. Newer anesthetic agents like desflurane and sevoflurane are designed to have low blood solubilities in order to limit uptake and decrease recovery time.
Oxygen and Carbon Dioxide Carriage in Blood
Oxygen
There are two forms of oxygen carried in the blood: that in true solution and that in chemical combination with hemoglobin. The solubility coefficient for dissolved oxygen is equal to 0.00304 mL/mm Hg dL. At an arterial Po2 of 95 mm Hg, this corresponds to a dissolved oxygen content of 0.029 mL/dL, or less than 2% of the total oxygen content of arterial blood. Breathing 100% oxygen to achieve a Po2 of 600 mm Hg will result in a dissolved oxygen content of 1.82 mL/dL, which is still only about 10% of total arterial oxygen content.
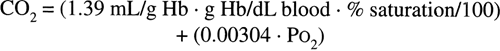
The largest component of blood oxygen is contained in hemoglobin. Hemoglobin is a molecule made up of a protein (globin) and four iron-containing porphyrin rings (heme). Each heme group is capable of binding one oxygen molecule; hence, each molecule of hemoglobin can bind four molecules of oxygen. The kinetics of oxygen binding is such that binding of an oxygen molecule facilitates the binding of subsequent oxygen molecules. This facilitation results in the characteristic sigmoid shape of the oxygen dissociation curve (Fig. 7-5). Like dissolved oxygen, the amount of oxygen in chemical combination with hemoglobin is also a function of Po2. However, once all the available sites on hemoglobin have been saturated, bound oxygen becomes independent of Po2. The maximum oxygen-binding capacity of 1 gram of hemoglobin is equal to 1.39 mL. (This value is sometimes reduced to 1.34 mL/g to account for normal levels of methemoglobin and carboxyhemoglobin.) Thus, the total oxygen content of blood, which is the sum of dissolved and hemoglobin-bound oxygen, becomes:
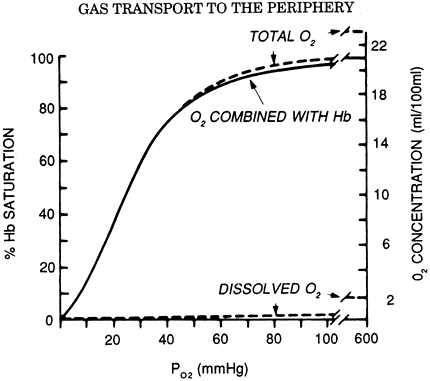 |
Fig. 7-5. Oxygen dissociation curve (solid line) for pH 7.4, Pco2 40 mm Hg, and 37 C. The total blood O2 concentration is also shown for a hemoglobin concentration of 15 g per 100 mL of blood. From West JB: Respiratory Physiology: The Essentials. Baltimore: Williams&Wilkins, 1995, p. 73. With permission. |
Using a normal hemoglobin value of 15 g/dL, an arterial saturation of 97% and a mixed venous saturation of 75% gives approximate oxygen content values of 20 and 15 mL/dL, respectively, and an arterial venous oxygen difference of 5 mL/dL. Once arterial saturation has reached 100%, increasing the inspired Po2 will not result in any significant increase in oxygen content. Only with hyperbaric oxygen administration can dissolved oxygen be increased to significant levels.
The relationship between hemoglobin saturation and Po2 determines the kinetics of oxygen loading in the lung and unloading in the tissues. Increased temperature, low pH, and high Pco2 all cause the curve to shift to the right, facilitating oxygen unloading to tissues with high metabolic activity. A decrease in 2,3-diphosphoglycerate, such as seen with stored blood, causes a left shift in the curve and impairment of oxygen unloading, although this is of uncertain clinical significance.
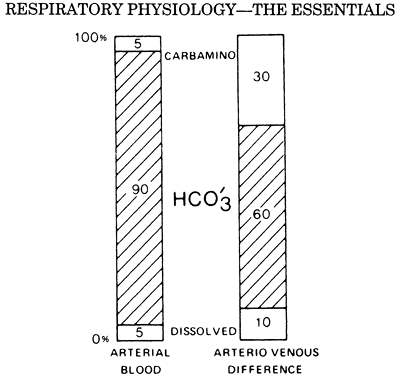 |
Fig. 7-6. The first column shows the proportions of the total CO2 concentration in arterial blood. The second column shows the proportions that make up the arterial venous difference. From West JB: Respiratory Physiology: The Essentials. Baltimore: Williams&Wilkins, 1995, p. 78. With permission. |
P.98
Carbon Dioxide
Carbon dioxide is also carried in the blood in true solution and in chemical combination with hemoglobin, but by far the largest quantity of carbon dioxide is in the form of bicarbonate ion. Bicarbonate accounts for approximately 90% of the carbon dioxide in the blood. Figure 7-6 shows the relative contribution of bicarbonate, carbaminohemoglobin, and dissolved carbon dioxide to total arterial carbon dioxide content. All three of these carbon dioxide moieties are a function of Pco2.
The solubility of dissolved carbon dioxide gas is 20 times greater than dissolved oxygen; thus, the solubility coefficient is approximately 0.06 mL/mm Hg dL. The capacitance coefficient of carbon dioxide in blood, which includes carbaminohemoglobin and bicarbonate, is on the order of 1 mL/mm Hg dL. Typical values for arterial and venous carbon dioxide content are 50 and 54 mL/dL respectively, with an arterial venous difference of 4 ml/dL. Figure 7-7 illustrates how the relation between total carbon dioxide content and partial pressure is steeper and relatively linear in comparison with the sigmoid shape of the oxygen dissociation curve. This has important implications in the setting of V/Q mismatch.
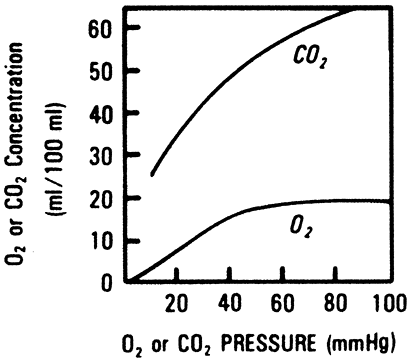 |
Fig. 7-7. Carbon dioxide dissociation curves for blood of different O2 saturations. Note that oxygenated blood carries less CO2 for the same Pco2. The inset shows the physiological curve between arterial and mixed venous blood. From West JB: Respiratory Physiology: The Essentials. Baltimore: Williams&Wilkins, 1995, p. 79. With permission. |
Interactions of Oxygen and Carbon Dioxide Transport
The oxygen dissociation curve for hemoglobin is shifted to the left by an increase in Pco2, a phenomenon termed the Bohr effect. This decreased affinity for oxygen is a result of both carbon dioxide and pH effects on hemoglobin configuration. Thus, the higher Pco2 in the tissues facilitates oxygen unloading.
Carbon dioxide capacity in blood is increased in the presence of deoxygenated hemoglobin for two reasons. First, bicarbonate formation increases because deoxygenated hemoglobin is a more effective buffer of H+ ions. Second, deoxygenated hemoglobin has a greater affinity for the formation of carbaminohemoglobin. Figure 7-6 illustrates the disproportionately large contribution of carbaminohemoglobin to the arterial venous difference. This increase in total carbon dioxide capacity with hemoglobin desaturation is termed the Haldane effect. The low Po2 in the tissues facilitates carbon dioxide loading, and the high Po2 in the alveolus facilitates carbon dioxide unloading.
Acid Base Chemistry
Carbon dioxide elimination by the lung accounts for the majority of acid excretion by the body, exceeding renal excretion of non carbonic acid by a factor of 100. Changes in ventilation relative to carbon dioxide production can thus have profound effects on acid base status. Most discussions of acid base physiology categorize disturbances into respiratory or metabolic disturbances and focus heavily on the Henderson-Hasselbalch equation, which is a mathematical expression for bicarbonate formation from carbon dioxide,
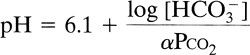
where is the solubility coefficient for carbon dioxide in moles and is equal to 0.03 mEq/L mm Hg. Under normal conditions and a Pco2 of 40 mm Hg, dissolved carbon dioxide is 1.2 mEq/L and HCO3 is 24 mEq/L, giving a calculated pH of 7.4.
It is worth noting that the above equation is a statement of mathematics and not physiology. Given any two of the three variables pH, Pco2, and HCO3 , it is possible to solve for the third. But this in no way implies a cause-and-effect
P.99
relation between pH and HCO3 concentration, nor does it fully define the etiology of an acid base disturbance.
In recent years there has been increasing popularity of another approach to acid base status that looks at H+ physiology from a much broader perspective than just the Henderson-Hasselbalch equation. First described by Stewart (1983), this approach delineates five additional general equations involving H+ ion chemistry to yield a total of six, including Henderson-Hasselbalch. To adequately define the determinants of H+ ion concentration, one has to solve all six equations simultaneously. In doing so, one is left with an equation that contains only three independent variables: Pco2, total weak acid (buffer), and a quantity termed the strong ion difference (SID), which is an expression of the net amount of strong acid or base. These three independent variables are the sole determinants of the H+ ion concentration. They are also the sole determinants of other dependent variables, such as OH- and Hco3 concentration. Independent variables can be changed primarily and independently of one another, whereas dependent variables cannot.
In the context of acid base chemistry, Pco2 is an independent variable; its value can be altered primarily either by changes in ventilation or carbon dioxide production. High Pco2 causes acidosis; low Pco2 causes alkalosis. In plasma, total weak acid is represented by albumin and inorganic phosphate.
In the red cell, total weak acid is represented by hemoglobin. Although the protonated and nonprotonated concentrations of these compounds are dependent variables, the sum of these, or the total weak acid, is an independent variable. Albumin, for example, can be altered primarily by changes in liver synthesis. An increase in total weak acid causes acidosis; a decrease causes alkalosis. Fencl and colleagues (2000) showed that the profound hypoalbuminemia often seen in critically ill patients creates an alkalosis that can mask other acid base abnormalities.
The strong ion difference is the net charge of strong cations minus strong anions. Strong cations include Na+, K+, Ca2+, and Mg2+. Strong anions include Cl- and lactate. The strong ion difference is regulated primarily through changes in renal excretion of Cl. Strong cations outnumber strong cations in plasma, and a normal strong ion difference is around 40 mEq/L. Anything that increases this difference results in alkalosis. Chloride wasting by the kidney or from gastric suctioning is associated with this form of alkalosis. Note that it is the loss of chloride from the gastric fluid and not the loss of H+ ions that causes the alkalosis. Anything that decreases the strong ion difference results in acidosis. Sodium loss from diarrhea, increased lactate production, or dilution of plasma with normal saline (which has an SID of zero) will all decrease the strong ion difference and result in acidosis.
Table 7-1 summarizes the effects of these three independent variables on plasma pH. Fencl and Leith (1993) have outlined a qualitative application of the Stewart approach to explain difficult concepts such as chloride-sensitive metabolic alkalosis and dilutional acidosis.
Table 7-1. Classification of Acid Base Disturbances | ||||||||||||||||||||||||
|---|---|---|---|---|---|---|---|---|---|---|---|---|---|---|---|---|---|---|---|---|---|---|---|---|
| ||||||||||||||||||||||||
Diffusion of Gases Within Tissues
Transport of gas between the blood and the mitochondria also occurs via the combined processes of convection and diffusion. Whereas gas exchange across the alveolar membrane is normally perfusion dependent, gas exchange at the tissue level is diffusion dependent. Blood leaving the tissue capillary has not fully equilibrated with tissue Po2. Each capillary can be imagined to supply a cylinder of tissue surrounding it. Blood Po2 falls along the length of the capillary as oxygen diffuses out, and tissue Po2 falls with increasing distance from the capillary. The cells farthest away from the venous end of the capillary are thus the most susceptible to anoxia.
Several physiologic mechanisms protect against the development of anoxia. Tissues such as skeletal muscle have the ability to recruit additional capillary beds, thereby increasing the total surface area available for diffusion and decreasing the furthest distance between capillary and tissue. Moreover, there is evidence that an adequate gradient for diffusion to the mitochondria still exists with tissue Po2 as low as 1 to 3 mm. If oxygen delivery is decreased for any reason, increased tissue extraction is able to preserve oxygen consumption at a lower tissue and mixed venous Po2. This delivery independence of oxygen consumption exists until delivery drops below approximately 8 mL/kg per minute. Below this level, oxygen consumption is no longer determined by the metabolic needs of the cell, utilization becomes delivery dependent, and cellular hypoxia ensues.
ETIOLOGY AND DIAGNOSIS OF IMPAIRED GAS EXCHANGE
Change in Inspired Gas
Decreased inspired Po2 will cause a decrease in alveolar Po2. This can be the result of a change in the fractional concentration of inspired oxygen (FIO2), such as with the administration of a hypoxic gas mixture during anesthesia, or the result of a decrease in barometric pressure. In most instances the gradient between alveolar and arterial Po2 will
P.100
remain the same. Only under conditions of extremely low Po2, such as seen at very high altitudes, will the decrease in driving pressure lead to diffusion limitation and an increased alveolar arterial gradient.
Under normal circumstances, inspired Pco2 is zero. Asphyxiation due to a lack of fresh air supply is the result of rebreathing gas with progressively higher Pco2 and lower Po2. Hypercarbia as a result of increased inspired Pco2 can also occur iatrogenically with respiratory equipment that allows rebreathing of exhaled gas.
Hypoventilation
Decreased ventilation disrupts the equilibrium between gas exchange by the lung and the tissues, causing carbon dioxide to accumulate and oxygen to fall. At the new steady state, gas exchange by the lung has returned to its normal value, but at a higher alveolar Pco2 and a lower alveolar Po2. The new alveolar Pco2 can be predicted from the alveolar gas equation for carbon dioxide:
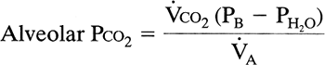
where Vco2 is carbon dioxide production and VA is alveolar ventilation.
Thus, a halving of alveolar ventilation would result in a doubling of Pco2 from 40 to 80 mm Hg. The effect on alveolar Po2 is not linear (because whereas inspired carbon dioxide is zero, expired oxygen is not) but can be predicted from the alveolar gas equation for oxygen (see the equation just given). Hypoventilation affects alveolar and arterial gas composition equally; a normal alveolar arterial gradient is the hallmark of hypoxemia due to pure hypoventilation. Causes of hypoventilation are traditionally divided into can't breathe and won't breathe. Examples of the former are severe airway obstruction and neuromuscular disease, and the latter is seen with drug overdose and Pickwickian syndrome.
Diffusion Block
The flux of gas from the alveolar space into the red blood cell involves diffusion between different phases and across various membranes. Rather than calculate these individually, the total diffusing capacity is used to express the relation between a pressure gradient and gas flux across the lung.
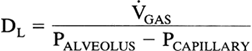
Ideally, one would like to measure the diffusing capacity of oxygen, but this is impractical because the partial pressure of oxygen in the capillary cannot be directly measured. This problem is overcome by using carbon monoxide, a gas so highly soluble in blood that the capillary partial pressure remains essentially zero along the length of the capillary. The pressure gradient simplifies to Paco, and the equation becomes
In the single-breath method, the patient inhales a gas mixture containing a known quantity of carbon monoxide and helium. Helium is relatively insoluble and is used to calculate the lung volume and initial Paco. Mean Paco is obtained from the calculated initial Paco and the measured end-tidal Pco; the difference between them is used to calculate carbon monoxide uptake (Vco).
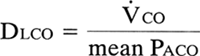
Note that the diffusing capacity is not a true capacity, but rather a conductance, and is analogous to the inverse of resistance of an electrical circuit also known as capacitance. The total resistance to diffusion is the sum of the resistance across the alveolar capillary membrane (1/DM) plus the resistance associated with the reaction of gas with hemoglobin inside the red blood cell (Fig. 7-8):
![]()
where [V with dot above]c is the volume of blood in the capillaries and is the rate at which the gas can combine with hemoglobin. is less when the hemoglobin concentration is low and oxygen saturation is high.
The following factors will result in an increased Dlco:
Increased distance between alveolus and red blood cell
Decreased total surface area
Anemia
Low oxygen saturation
Decreased blood volume
Diffusion block has been implicated as the cause of hypoxemia in diseases such as idiopathic pulmonary fibrosis, asbestosis, sarcoidosis, and alveolar cell carcinoma. It is apparent, however, that an abnormal diffusing capacity can result from many factors other than thickening of the alveolar capillary membrane. In fact, any process that creates
P.101
maldistribution of blood flow can be considered to decrease the effective alveolar surface area. Most of the hypoxemia previously attributed to a diffusion block across a thickened membrane is now thought to be due to V/Q mismatch. The term transfer factor has been adopted instead of diffusing capacity in order to underscore the influence of processes other than diffusion on the Dlco.
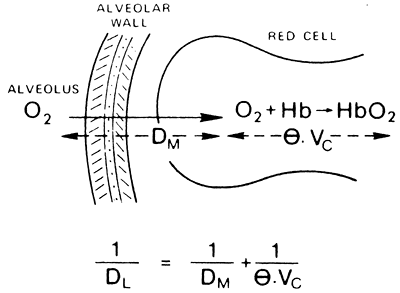 |
Fig. 7-8. The diffusing capacity of the lung (Dl) is made up of two components: that due to the diffusion process itself, and that attributable to the time taken for O2 (or CO) to react with hemoglobin. From West JB: Respiratory Physiology: The Essentials. Baltimore: Williams&Wilkins, 1995, p. 28. With permission. |
Low Cardiac Output
The effect of low cardiac output on arterial Po2 is unpredictable. In the absence of V/Q mismatch, a decrease in cardiac output would be expected to decrease mixed venous Po2 but have no effect on arterial or alveolar Po2. In the presence of a fixed shunt, however, the desaturated mixed venous blood lowers arterial Po2 and increases the alveolar arterial gradient. Lynch (1979) and Dantzker (1980) and their associates observed that most decreases in cardiac output are accompanied by a proportional decrease in shunt fraction. The net effect of these opposing processes is that arterial Po2 is often unchanged. Of course, because oxygen delivery is directly proportional to cardiac output, any decrease in cardiac output that drops oxygen transport below the threshold for delivery-independent uptake will cause tissue hypoxia.
Similarly, a decrease in cardiac output causes an increase in mixed venous Pco2. Arterial and alveolar Pco2 remain unchanged unless the low cardiac output causes pulmonary hypoperfusion and an increase in dead space. In this setting, with ventilation held constant, both the arterial and alveolar Pco2 rise and the arterial end-tidal CO2 gradient widens. In the operating room, a drop in the end-tidal Pco2 is often the first indication of decreased cardiac output.
Ventilation-Perfusion Mismatch
[V with dot above]/[Q with dot above] mismatch exists when the ratio of ventilation to perfusion is not homogeneous throughout the lung. Even healthy lungs exhibit some degree of heterogeneity due to the effects of gravity on blood flow and lung compliance. Any degree of heterogeneity impairs the efficiency of gas exchange. Owing to the differences in their solubility curves, oxygen is much more affected by [V with dot above]/[Q with dot above] mismatch than is carbon dioxide. The presence of [V with dot above]/[Q with dot above] mismatch indicates that some alveoli are hypoventilated (low [V with dot above]/[Q with dot above]) whereas others are hyperventilated (high [V with dot above]/[Q with dot above]). In the case of carbon dioxide, the increased elimination from areas of high [V with dot above]/[Q with dot above] partially compensates for the areas of low [V with dot above]/[Q with dot above]. In the case of oxygen, alveoli with normal [V with dot above]/[Q with dot above] are already saturated with oxygen because the solubility curve is flat at this Po2. Although the hyperventilated units have a higher Po2, this does not translate into higher oxygen content. Thus, the areas of high [V with dot above]/[Q with dot above] do not compensate for the areas of low [V with dot above]/[Q with dot above] with regard to oxygen uptake. Mixing of blood from these units results in hypoxemia and an increased alveolar arterial gradient that is characteristic of [V with dot above]/[Q with dot above] mismatch.
Hypoxemia due to [V with dot above]/[Q with dot above] mismatch will respond to an increase in Fio2 or an increase in total ventilation as long as there is some degree of ventilation present in the low-[V with dot above]/[Q with dot above] units. Areas in which there is perfusion but no ventilation whatsoever ([V with dot above]/[Q with dot above]= 0) represent intrapulmonary shunt. Blood leaving these units will have a gas composition identical to mixed venous regardless of therapies that increase Fio2 or ventilation. Administration of 100% oxygen does not significantly improve Po2 in this setting and serves as a test to distinguish true shunt from a less extreme [V with dot above]/[Q with dot above] mismatch. Only therapies that decrease the shunt fraction are effective in correcting the hypoxemia.
The primary cause of intrapulmonary shunt is air space disease. This can be broadly classified into alveoli that are collapsed versus alveoli that are filled. Pneumothorax, atelectasis, and right main-stem intubation are common causes of alveolar collapse. Alveoli may be filled with edema (congestive heart failure, adult respiratory distress syndrome), blood (contusion), or pus (pneumonia). Note that in all of these cases, the air space disease is usually detectable by chest radiography. Reexpansion of alveolar collapse is accomplished with suctioning, endotracheal tube repositioning, or chest tube placement. Diseases associated with filled alveoli will often respond to positive end-expiratory pressure, indicating that some alveoli are still recruitable.
Any area in which there is ventilation but no perfusion ([V with dot above]/[Q with dot above] = ) represents pulmonary dead space. The trachea, bronchi, and nonrespiratory bronchioles constitute the anatomic dead space, which occupies approximately 2.2 mL/kg and remains relatively constant at different lung volumes. For this reason, alveolar ventilation will increase more with an increase in tidal volume than with an equivalent increase in rate.
Physiologic dead space is equal to the anatomic plus the alveolar dead space and is a measure of the total wasted ventilation to the lung. Physiologic dead space ventilation is normally 25% to 35% of minute ventilation but is increased by anything that causes pulmonary hypoperfusion or alveolar hyperinflation. This includes pulmonary embolus, low output state, and dynamic air trapping. In contrast to most causes of shunt, most causes of increased dead space are not easily seen on chest radiography. In the case of pulmonary hypoperfusion, gas exchange is usually improved by increasing minute ventilation. In the setting of alveolar hyperinflation, increasing minute ventilation can worsen air trapping and lead to further impairment of gas exchange.
Measurement of arterial blood gases can give a rough estimate of [V with dot above]/[Q with dot above] mismatch. Arterial Pco2 is used to calculate the alveolar Po2 (see the alveolar gas equation given earlier). The difference between the alveolar and arterial Po2 is the alveolar arterial gradient for oxygen. A normal gradient exists due to blood flow through the bronchial and thebesian arteries as well as normal [V with dot above]/[Q with dot above] mismatch. A gradient less than 15 mm Hg is considered normal in an adult breathing room air. This value can increase to 37 mm Hg in
P.102
the elderly. Anything beyond this signifies an increased mixing of arterial blood with blood from areas of low [V with dot above]/[Q with dot above].
Whereas areas of low [V with dot above]/[Q with dot above] primarily affect the arterial Po2, areas of high [V with dot above]/[Q with dot above] have a pronounced effect on the end-tidal Pco2. The arterial end-tidal gradient for carbon dioxide is a good qualitative measurement of the alveolar dead space. In the absence of alveolar dead space, this gradient is zero. In a patient with an arterial Po2 of 40 and an end-tidal Po2 of 20, half of the alveolar volume is alveolar dead space. Patients with chronic lung disease invariably have a large gradient between Paco2 and Petco2. In the intraoperative setting, an acute widening of the arterial end-tidal Pco2 gradient may herald an acute cause of pulmonary hypoperfusion such as pulmonary embolus.
In some instances it is desirable to have a more quantitative assessment of [V with dot above]/[Q with dot above] mismatch. The physiologic shunt equation is as follows:
where Qs/Qt is the fraction of cardiac output that is shunted and Cc o2 is the oxygen content of capillary blood exiting from an ideal alveolus. Thus, to solve the shunt equation, one needs to know the arterial and mixed venous Po2, the ideal alveolar Po2 (from the arterial Pco2 and the alveolar gas equation), and the corresponding hemoglobin saturations in order to calculate oxygen contents. Normal Qs/Qt is less than 5% but can increase to greater than 50% in patients with acute respiratory failure. Note that Qs/Qt is a reflection of all units with [V with dot above]/[Q with dot above] ratios that are less than the ideal alveolus but not necessarily equal to zero (true shunt). In this regard, it is more accurate to refer to Qs/Qt as a measurement of overall venous admixture.
A quantitative measurement of wasted ventilation is provided by the physiologic dead space equation:
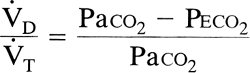
where [V with dot above]D/[V with dot above]T is the fraction of total ventilation that is wasted and Peco2 is the mixed expiratory Pco2. This last variable includes both alveolar gas and anatomic dead space gas and should not be confused with end-tidal (end-expiratory) Pco2, which is an index of alveolar gas only. [V with dot above]d/[V with dot above]t is considered a measure of overall wasted ventilation because it reflects all units with [V with dot above]/[Q with dot above] ratios greater than the ideal alveolus as well as the true dead space. Physiologic dead space greater than 65% is associated with respiratory failure.
GAS EXCHANGE IN THE NON STEADY STATE
Apnea
Apnea is an unsteady state that represents the most extreme form of hypoventilation. In contrast to less extreme hypoventilation, in which lung gas exchange returns to baseline at steady state (albeit at a higher Paco2 and a lower Paco2), with apnea the new steady state is reached only when tissue gas exchange falls to zero (i.e., death). With the onset of apnea, there is rapid equilibration between mixed venous, alveolar, and arterial Pco2. Thereafter the Pco2 in all three compartments increases at a rate of 3 to 6 mm Hg/min. This relatively slow increase in Pco2 is due to the large capacity of the carbon dioxide body stores to buffer Pco2 against changes in ventilation. Less than 10% of tissue carbon dioxide production enters the lung, whereas the remainder is taken up by the body stores.
In contrast, oxygen body stores are small and unable to maintain Po2 in the face of absent ventilation. Continued lung uptake of oxygen exceeds addition of carbon dioxide gas to the alveolus, and the respiratory exchange ratio falls. If the airway is occluded, this causes a decrease in lung volume. If the airway is patent, this causes entrainment of ambient gas. The rate at which the arterial Po2 falls depends on the patency of the airway and the ambient gas composition.
Apneic oxygenation is a technique in which a patent airway is exposed to 100% oxygen. Under these conditions, lung volume remains at functional residual capacity, and dry alveolar gas contains only oxygen and carbon dioxide. Any increase in Pco2 is exactly mirrored by a decrease in Po2. If the patient is preoxygenated with 100% oxygen prior to apnea, the initial alveolar Po2 can be as high as 660 mm Hg. This theoretically affords over 1 hour before hypoxia occurs. Although long periods of apneic oxygenation have been demonstrated in animals and humans, clinically, this technique is usually limited to 5 minutes to avoid complications from hypercarbia and respiratory acidosis.
Cardiac Arrest
Cardiac arrest is another example of a non steady state in which equilibrium is reached only when tissue gas exchange falls to zero. In the presence of artificial ventilation, alveolar and pulmonary capillary gas compositions quickly approach that of inspired gas as the stagnant blood in the lungs is emptied of carbon dioxide and saturated with oxygen. Lung gas exchange falls to zero. At the tissue level, capillary Po2 continues to fall and Pco2 continues to rise until gas exchange ceases. Thus, there is an enormous Po2 and Pco2 gradient between pulmonary and systemic capillary blood. With very low flow states, such as during cardiopulmonary resuscitation (CPR), this gradient becomes evident between the arterial and mixed venous blood. Arterial blood gas samples during CPR generally show high Po2 and low Pco2. Mixed venous blood is characterized by very low Po2, high Pco2, and a combined respiratory and metabolic acidosis. Weil and co-workers (1986) found that arterial pH greatly underestimated the degree of acidosis present in mixed venous blood and cautioned against its use as the sole guide to acid base therapy during resuscitation.
Where mixed venous blood sampling is unavailable, the most useful index of perfusion may be the end-tidal Pco2.
P.103
Jin and coauthors (2000) found a strong correlation between end-tidal Pco2 and cardiac index in a porcine model of circulatory shock. In cardiac arrest patients, Falk and associates (1988) noted an increase in end-tidal Pco2 with the onset of chest compressions, followed by a rapid rise and transient overshoot in those patients regaining spontaneous circulation. In summary, during low flow states, mixed venous blood and end-tidal Pco2 correlate with systemic and pulmonary perfusion, respectively, while the arterial blood gas composition reflects the adequacy of ventilation.
REFERENCES
Clark JM, Hagerman FC, Gelfand R: Breathing patterns during submaximal and maximal exercise in elite oarsmen. J Appl Physiol 55:440, 1983.
Dantzker DR, Lynch JP, Weg JG: Depression of cardiac output is a mechanism of shunt reduction in the therapy of acute respiratory failure. Chest 77:636, 1980.
Falk, JL, Rackow EC, Weil MH: End-tidal carbon dioxide concentration during cardiopulmonary resuscitation. N Engl J Med 318:607, 1988.
Fencl V, Leith DE: Stewart's quantitative acid base chemistry: applications in biology and medicine. Respir Physiol 91:1, 1993.
Fencl V, et al: Diagnosis of metabolic acid base disturbances in critically ill patients. Am J Respir Crit Care Med 162:2246, 2000.
Fenn WO, Rahn H (eds): Handbook of Physiology: Respiration. Section 3, Vol. 1. Baltimore: Williams&Wilkins, 1964, p. 841.
Jin X, et al: End-tidal carbon dioxide as a noninvasive indicator of cardiac index during circulatory shock. Crit Care Med 28:2415, 2000.
Lynch JP, Mhyre JG, Dantzker DR: Influence of cardiac output on intrapulmonary shunt. J Appl Physiol 46:315, 1979.
Stewart PA: Modern quantitative acid base chemistry. Can J Physiol Pharmacol 61:1444, 1983.
Weil MH, et al: Difference in acid base state between venous and arterial blood during cardiopulmonary resuscitation. N Engl J Med 315:153, 1986.
Reading References
Leff AR, Schumacker PT: Respiratory Physiology: Basics and Applications. Philadelphia: WB Saunders, 1993.
Nunn JF: Applied Respiratory Physiology. 3rd Ed. London: Butterworths, 1987.
West JB: Respiratory Physiology: The Essentials. 5th Ed. Baltimore: Williams&Wilkins, 1995.
EAN: 2147483647
Pages: 203