Chapter 13: Working with Photographic Images
Whether you're putting together a slide show to display your vacation photos or adding photos of industrial products to a business presentation, PowerPoint has the tools and capabilities you need. And with the new Picture Styles feature in PowerPoint 2007, it has never been easier to give those photos professional-looking frames, shadows, and other effects.
In this chapter you'll learn the ins and outs of using photographs in a PowerPoint presentation, including tips and tricks for preparing them beforehand, compressing them so they take up less disk space, and exporting pictures out of PowerPoint so you can save them separately.
Understanding Raster Graphics
There are two kinds of graphics in the computer world: vector and raster. As you learned earlier in the book, vector graphics (clip art, drawn lines and shapes, and so on) are created with mathematical formulas. Some of the advantages of vector graphics are their small file size and the fact that they can be resized without losing any quality. The main disadvantage of a vector graphic is that it doesn't look "real." Even when an expert artist draws a vector graphic, you can still tell that it's a drawing, not a photograph. For example, perhaps you've seen the game The Sims? Those characters and objects are 3-D vector graphics. They look pretty good but there's no way you would mistake them for real people and objects.
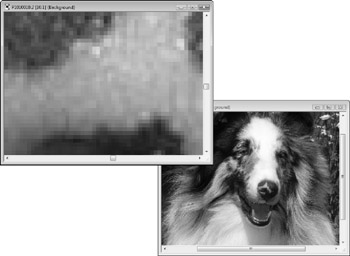
In this chapter, you'll be working with raster graphics. A raster graphic is made up of a very fine grid of individual colored pixels (dots). The grid is sometimes called a bitmap. Each pixel has a unique numeric value representing its color. Figure 13.1 shows a close-up of a raster image. You can create raster graphics from scratch with a "paint" program on a computer, but a more common way to acquire a raster graphic is by using a scanner or digital camera as an input device.

Figure 13.1: A raster graphic, normal size (right) and zoomed in to show individual pixels (left).
| Note | The term bitmap is sometimes used to refer generically to any raster graphic, but it is also a specific file format for raster graphics, with a BMP extension. This is the default format for the Paint program that comes with Windows XP and Windows XP desktop wallpaper. |
Because there are so many individual pixels and each one must be represented numerically, raster graphics are much larger than vector graphics. They take longer to load into the PC's memory, take up more space when you store them as separate files on disk, and make your PowerPoint presentation file much larger. You can compress a raster graphic so that it takes up less space on disk, but the quality may suffer. Therefore, it's best to use vector graphics when you want simple lines, shapes, or cartoons and reserve raster graphics for situations where you need photographic quality.
The following sections explain some of the technical specifications behind raster graphics; you'll need this information to make the right decisions about the way you capture the images with your scanner or digital camera, and the way you use them in PowerPoint.
Resolution
The term resolution has two subtly different meanings. One is the size of an image, expressed in the number of pixels of width and height, such as 800×600. The other meaning is the number of pixels per inch when the image is printed, such as 100 dots per inch (dpi). The former meaning is used mostly when referring to images of fixed physical size, such as the display resolution of a monitor. In this book, the later meaning is mostly used.
If you know the resolution of the picture (that is, the number of pixels in it), and the resolution of the printer on which you will print it (for example, 300 dpi), you can figure out how large the picture will be in inches when you print it at its native size. Suppose you have a picture that is 900 pixels square, and you print it on a 300 dpi printer. This makes it 3 inches square on the printout.
Resolution on Preexisting Graphics Files
When you acquire an image file from an outside source, such as downloading it from a Web site or getting it from a CD of artwork, its resolution has already been determined. Whoever created the file originally made that decision. For example, if the image was originally scanned on a scanner, whoever scanned it chose the scan resolution-that is, the dpi setting. That determined how many individual pixels each inch of the original picture would be carved up into. At a 100 dpi scan, each inch of the picture is represented by 100 pixels vertically and horizontally. At 300 dpi, each inch of the picture is broken down into three times that many.
If you want to make a graphic take up less disk space, you can use an image-editing program to change the image size, and/or you can crop off one or more sides of the image.
| Caution | If you crop or decrease the size of an image in an image-editing program, save the changes under a different filename. Maintain the original image in case you ever need it for some other purpose. Decreasing the image resolution decreases its dpi setting, which decreases its quality. You might not notice any quality degradation on-screen, but you will probably notice a difference when you are printing the image at a large size. That's because the average monitor displays only 96 dpi, but the average printer prints at 600 dpi or higher. PowerPoint slides do not usually need to be printed at a professional-quality resolution, so image quality on a PowerPoint printout is not usually an issue. However, if you use the picture for something else later, such as printing it as a full-page color image on photo paper, then a high dpi file can make a difference. |
Resolution on Graphics You Scan Yourself
When you create an image file yourself by using a scanner, you choose the resolution, expressed in dpi, through the scanner software. For example, suppose you scan a 4-inch by 6-inch photo at 100 dpi. The scanner will break down each 1-inch section of the photo horizontally and vertically into 100 separate pieces and decide on a numeric value that best represents the color of each piece. The result is a total number of pixels of 4 × 100 × 6 × 100, or 240,000 pixels. Assuming each pixel requires 3 bytes of storage, the fill becomes approximately 720KB in size. The actual size varies slightly depending on the file format.
Now, suppose you scan the same photo at 200 dpi. The scanner breaks down each 1-inch section of the photo into 200 pieces, so that the result is 4 × 200 × 6 × 200, or 960,000 pixels. Assuming again that 1 pixel required 3 bytes for storage (24 bits), the file will be approximately 2.9MB in size. That's a big difference.
The higher the resolution in which you scan, the larger the file becomes, but the details of the scan also become finer. However, unless you are zooming in on the photo, you cannot tell a difference between 100 dpi and a higher resolution. That's because most computer monitors display at 96 dpi, so any resolution higher than that does not improve the output.
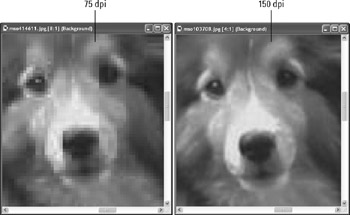
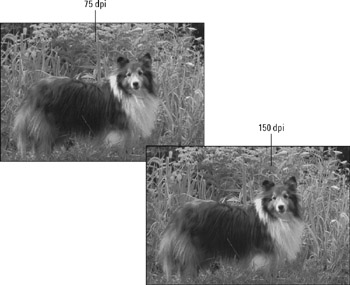
Let's look at an example. In Figure 13.2 you can see two copies of an image open in a graphics program. The same photo was scanned at 75 dpi (left) and 150 dpi (right). However, the difference between them is not significant when the two images are placed on a PowerPoint slide, as shown in Figure 13.3. The lower resolution image is at the top left, but there is no observable difference in the size at which they are being used.

Figure 13.2: At high magnification, the difference in dpi for a scan is apparent.

Figure 13.3: When the image is used at a normal size, there is virtually no difference between a high-dpi and low-dpi scan.
Resolution on Digital Camera Photos
Top-quality digital cameras today take very high resolution pictures, and are much higher than you will need for an on-screen PowerPoint presentation. At a typical size and magnification, a high-resolution graphic file is overkill; it wastes disk space needlessly. Therefore, you may want to adjust the camera's image size so that it takes lower-resolution pictures for your PowerPoint show.
If you think you might want to use those same pictures for some other purpose in the future, such as printing them in a magazine or newsletter, then go ahead and take them with the camera's highest setting, but you should compress them in PowerPoint or resize them in a third-party image editing program. See the section "Compressing Images" later in this chapter to learn how.
Color Depth
Color depth is the number of bits required to describe the color of a single pixel in the image. For example, in 1-bit color, a single binary digit represents each pixel. Each pixel is either black (1) or white (0). In 4-bit color, there are 16 possible colors because there are 16 combinations of 1s and 0s in a four-digit binary number. In 8-bit color there are 256 combinations.
If you are shopping for a scanner, you will probably notice that they're advertised with higher numbers of bits than the graphics formats support. This is for error correction. If there are extra bits, it can throw out the bad bits to account for "noise" and still end up with a full set of good bits. Error correction in a scan is a rather complicated process, but fortunately your scanner driver software takes care of it for you.
For most file formats, the highest number of colors you can have in an image is 16.7 million colors, which is 24-bit color (also called true color). It uses 8 bits each for Red, Green, and Blue.
There is also 32-bit color, which has the same number of colors as 24-bit, but adds 8 more bits for an Alpha channel. The Alpha channel describes the amount of transparency for each pixel. This is not so much an issue for single-layer graphics, but in multi-layer graphics, such as the ones you can create in high-end graphics programs like Photoshop, the extent to which a lower layer shows through an upper one is important.
| EXPERT TIP | For a great article on alpha channel usage in PowerPoint by Geetesh Bajaj, go to http://www.indezine.com/products/powerpoint/ppalpha.html. |
A color depth of 48-bit is fairly new, and it's just like 24-bit color except it uses 16 rather than 8 bits to define each of the three channels: Red, Green, and Blue. It does not have an Alpha channel bit. Forty-eight-bit color depth is not really necessary, because the human eye cannot detect the small differences it introduces. Of the graphics formats that PowerPoint supports, only PNG and TIFF support 48-bit color depth.
Normally, you should not decrease the color depth of a photo to less than 24-bit unless there is a major issue with lack of disk space that you cannot resolve any other way. To decrease the color depth, you would need to open the graphic file in a third-party image-editing program, and use the command in that program for decreasing the number of colors. Before going through that, try compressing the images in the presentation (see the section "Compressing Images" later in the chapter) to see if that solves the problem.
File Format
Many scanners scan in JPEG format by default, but most also support TIF, and some also support other formats. Images you acquire from a digital camera are almost always JPEG. Images from other sources may be any of dozens of graphics formats, including PCX, BMP, GIF, or PNG.
Different graphic formats can vary tremendously in the size and quality of the image they produce. The main differentiators between formats are the color depth they support and the type of compression they use (which determines the file size).
Remember earlier how I explained that each pixel in a 24-bit image requires 3 bytes? (That's derived by dividing 24 by 8 because there are 8 bits in a byte.) Then you multiply that by the height, and then by the width, to determine the image size. Well, that formula was not completely accurate because it does not include compression. Compression is an algorithm (basically a math formula) that decreases the amount of space that the file takes up on the disk by storing the data about the pixels more compactly. A file format will have one of these three states in regard to compression:
-
No compression: The image is not compressed.
-
Lossless compression: The image is compressed, but the algorithm for doing so does not throw out any pixels so there is no loss of image quality when you resize the image.
-
Lossy compression: The image is compressed by recording less data about the pixels, so that when you resize the image there may be a loss of image quality.
Table 13.1 provides a brief guide to some of the most common graphics formats. Generally speaking, for most on-screen presentations JPEG should be your preferred choice for graphics because it is compact and Web-accessible (although PNG is also a good choice and uses lossless compression).
| Extension | Pronunciation | Compression | Notes |
|---|---|---|---|
| JPEG or JPG | "Jay-peg" | Yes | Stands for Joint Photographic Experts Group. Very small image size. Uses lossy compression. Common on the Web. Up to 24-bit. |
| GIF | "gif" or "jif" | Yes | Stands for Graphic Interchange Format. Limited to 8-bit (256 color). Uses proprietary compression algorithm. Allows animated graphics, which are useful on the web. Color depth limitation makes this format unsuitable for photos. |
| PNG | "ping" | Yes | Stands for Portable Network Graphic. An improvement on GIF. Up to 48-bit color depth. Lossless compression, but smaller file sizes than TIF. Public domain format. |
| BMP | "B-M-P" or | No | Default image type for Windows XP. Up to 24-bit color. Used for some Windows wallpaper and other Windows graphics. |
| PCX | "P-C-X" | Yes | There are three versions: 0, 2, and 5. Use version 5 for 24-bit support. Originally introduced by a company called ZSoft; sometimes called ZSoft Paintbrush format. |
| TIF or TIFF | "tiff" | Optional | Stands for Tagged Image Format. Supported by most scanners and some digital cameras. Up to 48-bit color. Uses lossless compression. Large file size but high quality. |
| EXPERT TIP | If you are not sure what format you will eventually use for an image, scan it in TIF format and keep the TIF copy on your hard disk. You can always save a copy in JPEG or other formats when you need them for specific projects. The TIF format's compression is lossless, so it results in a high-quality image. |
EAN: 2147483647
Pages: 268