Using the Integrated iSeries Debugger in Development Studio Client Version 5.0
The integrated iSeries debugger has its own debug perspective. This perspective will open when the debugger is started.
Starting the Integrated iSeries Debugger
To start the debug session,
-
Right-click the QQF job in the tree view.
-
Select Debug As from the pop-up menu.
-
Select iSeries job from the submenu.
A message appears as shown in Figure 15.10.
Figure 15.10: Debug message
-
Press the OK push button in the message dialog.
The debug perspective displays, as shown in Figure 15.11.
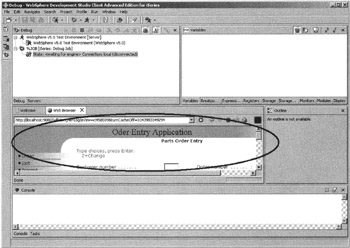
Figure 15.11: Debug perspective
To activate the debug session, use the browser window:
-
Press command key 4 in the Order Entry Application page.
Working with the Debug Perspective
| Tip | If you had a production library instead of the wflabxx test library, you would need to enable the Update Production Files debug option. You can do this for individual debug sessions in the debug Launch Configurations dialog, or you can use the workbench Preferences option under the Window menu option. In the Preferences dialog select the Debug node and then the iSeries debug node. In the corresponding preferences page check the Update production files check box. |
The debug session for the active ORDENTR program starts, and you see three different views as shown in Figure 15.12:
-
The source view, containing the program source being debugged .
-
The monitor view, with more information about the program. The active view here is the expression monitor, where you can see the content of your program variables .
-
The Call stack.
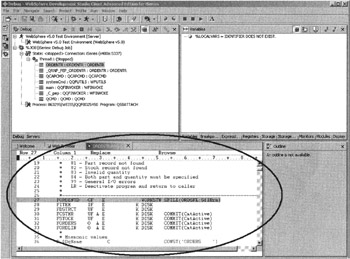
Figure 15.12: Debug perspective with source view and monitor view
To work with the program,
-
Scroll down in the source view to line 130, as shown in Figure 15.13.
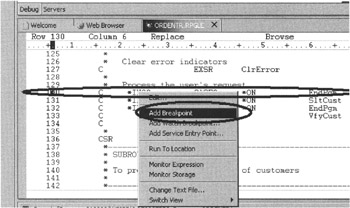
Figure 15.13: Adding a breakpoint to a line -
Select the line number.
-
Right-click the line number to set a breakpoint.
-
Select the Add Breakpoint option from the pop-up menu.
| Tip | You can also double-click in the prefix area to set a breakpoint. |
You will notice a small blue icon on the left side of the line, indicating that a breakpoint is set for this line, as shown in Figure 15.14.
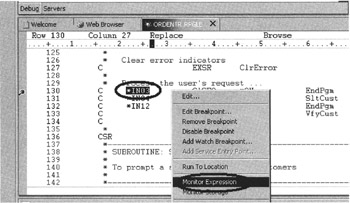
Figure 15.14: Selecting a variable to be added to the monitor
To monitor for the content of variable *IN03,
-
Double-click indicator *IN03 in line 130.
The indicator name is highlighted.
-
Right-click the highlighted indicator name.
-
Select the Monitor Expression option from the pop-up menu.
Now the variable *IN03 displays in the Monitors view, as shown in Figure 15.15.
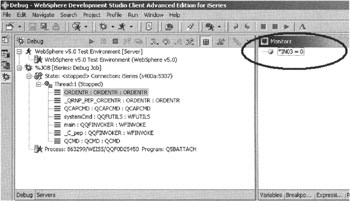
Figure 15.15: Monitors view with variable *IN03
Now add *IN04 to the monitor as well, following the same steps as before.
You are ready to run the application:
-
Press the Resume button to run your program, as shown in Figure 15.16.
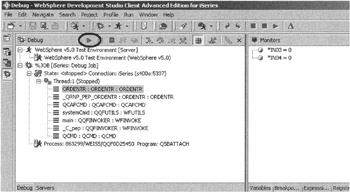
Figure 15.16: Run the application
The execution will stop on line 130, and you will see line 130 highlighted, as shown in Figure 15.17.
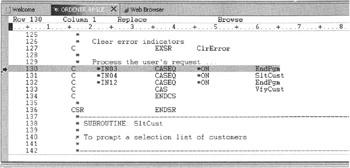
Figure 15.17: Debug window with current line highlighted
Now you can step through the program.
-
Click the Step Into push button on the debug toolbar, as shown in Figure 15.18.
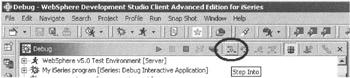
Figure 15.18: Step Into button on debug toolbar
You are on the line that conditions *IN04.
-
Check the value of *IN04.
Tip You can change the value of variables by going to the Monitors view and double-clicking the variable. This will allow you to edit the value.
-
Step further through the program.
You will come to a statement that calls program SLTCUSTR.
Stepping into a Called Program
Now you can decide whether you want to debug the called program or just let the pro-gram run. If you are not interested in debugging the called program, you would select Step Over or F6 ; that would call the program without debugging it. If you need to debug the programs in the call hierarchy, you would select Step Into. I want to show you how to debug programs in the call hierarchy, so select Step Into on this statement.
You will notice that the program source for the called program, in this case SLTCUSTR, is now loaded into the debugger source view, as shown in Figure 15.19.
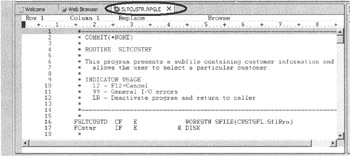
Figure 15.19: Source of program SLTCUSTR shown in debugger window
You can now step through this program and complete the following tasks :
-
Set breakpoints.
-
Monitor for variables.
Ending the Debug Session
I leave it up to you to work more with the debugger. When you are finished, complete the debug session:
-
Click the Run push button on the debugger toolbar.
-
Go back to the browser window in the workbench.
-
End your application by pressing F3 .
-
Check the debug view for any nonterminated sessions, and use the Terminate and Remove option on the pop-up menu of any active debug sessions.
Close the debugger perspective:
-
Right-click its icon on the workbench sidebar.
-
Select Close from the pop-up menu.
You have completed the debugging exercise in Development Studio Client Version 5.0 and can now skip to the "Analysis" heading.
EAN: 2147483647
Pages: 153