Using the Distributed Debugger in Development Studio Client Version 4.0
The Distributed Debugger is shipped with Version 4.0 of Development Studio Client, but it is not fully integrated into the Studio workbench. The debugger features are very similar to the Version 5.0 features, except the user interface is a bit different and the debugger is launched as a separate tool, outside the workbench.
Starting the IBM Distributed Debugger
To start the debug session,
-
Right-click the QQF job in the tree view.
-
Select the Debug option from the pop-up menu.
A Debugger Logon dialog opens, as shown in Figure 15.20.
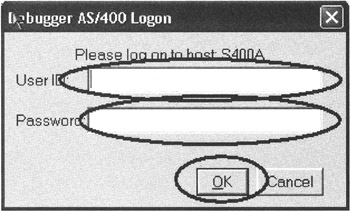
Figure 15.20: Debugger Logon dialog
-
Type in your User ID.
-
Type in your Password.
-
Click the OK push button.
An error message might display, as shown in Figure 15.21.
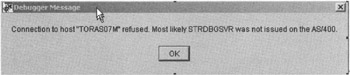
Figure 15.21: Error message that comes up if the debug server is not started
To fix the problem,
-
Switch to the Remote Systems Explorer perspective in the workbench.
In the command window of the RSE perspective,
-
Run the Start Debug Server command, STRDBGSVR, on your iSeries host, or go to an emulation window and run the command there. There are no parameters required for this command.
-
Click the OK push button on the message dialog.
You will see the logon dialog again, but now it should be connected to the debug server.
The Distributed Debugger Attach dialog appears, as shown in Figure 15.22.
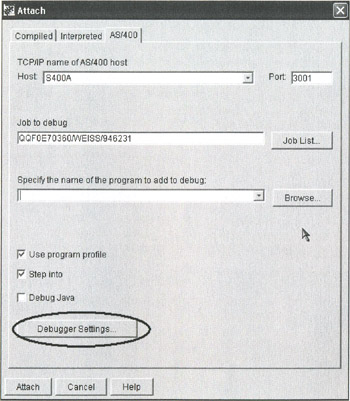
Figure 15.22: AS/400 page in Attach dialog
The input fields in the Attach dialog are already filled with the correct values. You do not need to specify a program name because the first active program in the job will be put in debug mode.
I will show how to enable the debug option Update Production Files, in case you are working with a production library instead of the wflabxx test library:
-
Click the Debugger Settings push button.
A dialog appears as shown in Figure 15.23.
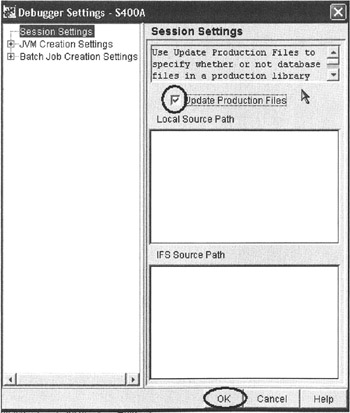
Figure 15.23: Debugger Settings dialog to enable the Update Production Files option
-
Select the Update Production Files check box.
-
Click the OK push button.
Back in the Attach dialog,
-
Click the Attach push button.
A message box displays, telling you to start your program, as shown in Figure 15.24.
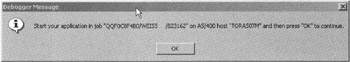
Figure 15.24: Message to start your program
Since your program is already started,
-
Click the OK push button in the message box.
Tip If the message box does not show up, it might be hidden. Check the taskbar for an icon showing D. Click the icon to bring the message to the foreground.
A progress bar as shown in Figure 15.25 will display.
Figure 15.25: Progress bar
Now the debugger is ready to connect to your program, but the program has to be active for the debugger to take control:
-
Go back to the workbench.
The browser window with the first application page should be visible.
-
Click the browser window to give it focus.
-
Press command key 4 to see the customer list.
The Distributed Debugger window opens with your program source loaded, as shown in Figure 15.26.
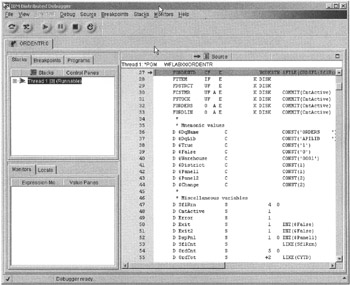
Figure 15.26: Distributed Debugger with source
Scroll down in the source pane to line 124.
-
Select the line number.
-
Double-click the line number to set a breakpoint.
-
Double-click indicator *IN03 in line 130.
The indicator name will be highlighted.
-
Right-click the highlighted indicator name.
-
Select Add to Program Monitor from the pop-up menu, as shown in Figure 15.27.
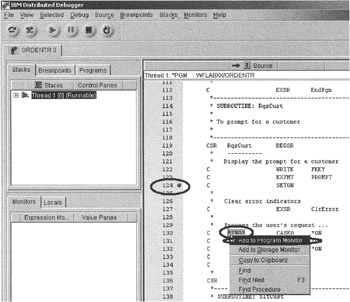
Figure 15.27: Debugger window with breakpoint and pop-up menu
The variable content will display in the Monitors pane, as shown in Figure 15.28.
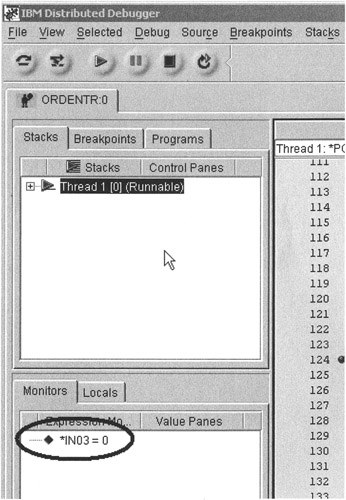
Figure 15.28: Debugger window with Monitors pane
-
Do the same for *IN04.
To activate the program,
-
Press the Run push button in the debugger toolbar, as shown in Figure 15.29.
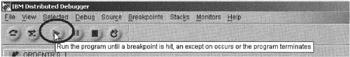
Figure 15.29: Debugger Run push button in toolbar
The program will stop at the breakpoint.
Now you can step through the program.
-
Press F7 on your keyboard.
Tip You can also use the Step Debug tool button or you can select the Debug menu option in the Debugger window. Then select the Step Debug option from the pull-down menu, as shown in Figure 15.30.
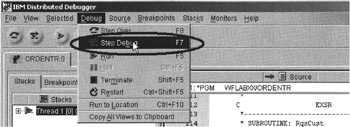
Figure 15.30: Debug menu options -
Check the value of your indicators; the value for IND04 should be 1.
-
Step through your program until you come to the line that conditions *IN04 (see Figure 15.31).
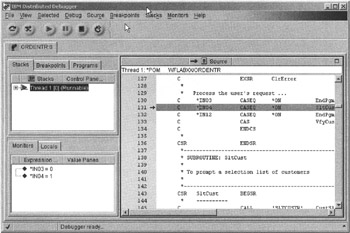
Figure 15.31: Debugger window with current active statement highlighted -
Step further through the program.
You will come to a statement that calls program SLTCUSTR.
Stepping into a Called Program
Now you can decide whether you want to debug the called program or just let the pro-gram run. If you are not interested in debugging the called program, you would select Step Over or F8 . That would call the program without debugging it and stop at the next line after the call. If you need to debug the programs in the call hierarchy, you would select Step Debug. I want to show you how to debug programs in the call hierarchy, so select Step Debug on this statement.
You will notice that the program's source, in this case SLTCUSTR, is now loaded into the debugger source view, as shown in Figure 15.32.
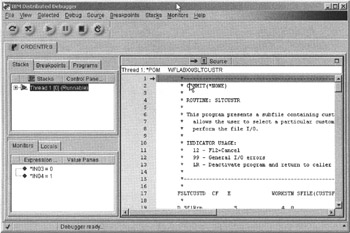
Figure 15.32: Source of program SLTCUSTR shown in debugger window
You can now step through this program by completing the following tasks :
-
Set breakpoints.
-
Monitor for variables .
-
Work with the call stack.
Ending the Debug Session
I leave it up to you to work with the debugger. When you are finished, complete the debug session:
-
Click the Run push button on the debugger toolbar.
-
Go back to the browser window in the workbench.
-
End your application by pressing F3 .
-
Close the debugger window.
EAN: 2147483647
Pages: 153
- Measuring and Managing E-Business Initiatives Through the Balanced Scorecard
- Technical Issues Related to IT Governance Tactics: Product Metrics, Measurements and Process Control
- Governing Information Technology Through COBIT
- The Evolution of IT Governance at NB Power
- Governance Structures for IT in the Health Care Industry