A. On-Time Delivery Issues Overview[1][1] Before reading this chapter, it is important to read and understand Chapter 1, "Introduction," particularly the section, "How to Use This Book."
Virtually all processes are designed to deliver an entity (anything from a single item to a whole shipment) to a Customer, clearly with a Customer's need of having the right entity at the right time (essentially a measure of effectiveness of the process). As the Supplier, we are also interested in the cost to deliver the entity, whether it is in labor or processing costs (measures of efficiency of our process). Examples Industrial. Product shipments Healthcare. Medications delivery/administration, laboratory/radiology turnaround Service/Transactional. Service delivery, invoicing
Measuring Performance In considering on-time delivery issues, we are focusing on measures of effectiveness of the process. Thus, to measure delivery performance, typical primary measures would comprise Accuracy (are we delivering the right entity, but not necessarily on time) measured as Or, conversely as Timeliness (are we delivering an entity on time, not necessarily the right entity) measured as A Replenishment Time from the Customer needing the entity to when it is available to usethis could be the entire Lead Time of our process, or merely a delivery time if we have inventory on hand, ready to ship. It is important to note the difference. For more detail see "TimeReplenishment Time" and "TimeLead Time" in Chapter 7, "Tools."
Tool Approach The roadmap commences with | 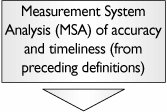 | For accuracy, a full Attribute MSA or Gage R&R might be required. For timeliness, the focus is on validity of the measure and not so much on the reliability of the measure. Thus, just a solid operational definition and validation probably will suffice. This should be conducted for the process as a whole, not for each of the individual steps in the process. For more detail see "MSAValidity," "MSAAttribute," and "MSAContinuous" in Chapter 7. | | 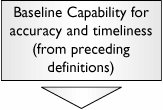 | This should be conducted for the process as a whole, not for each of the steps in the process. Later, however, it will be important to capture Capabilities for each step along the process, so if freely available at this point, capture them as well. For more detail see "CapabilityAttribute" and "CapabilityContinuous" in Chapter 7. | | 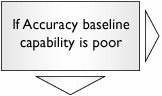 | Continue to Section C in this chapter and consider a defect to be "any time that the perfectly correct entity is not delivered." | | 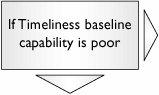 | It will be necessary to understand what is specifically in the process that is affecting the time. Continue down this roadmap. | | 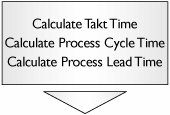 | It is important to understand the relationship between the Takt Time (the pace of use of entities), the Process Cycle Time (the actual pace of generation of entities), and the Process Lead Time (the time it takes a single entity to progress the length of the process). For more detail see "TimeTakt Time," "TimeGlobal Process Cycle Time," and "TimeProcess Lead Time" in Chapter 7. | | 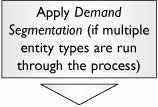 | This will allow us to understand the volume and variation in demand of each of the different entity types that progress through the process. High-volume, low-variation demand entities might have to be dealt with differently than low-volume, high-variation demand entities. | | 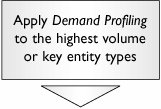 | For the higher volume or key entity types that pass through the process, it is important to understand the demand profile over time. Significant spikes in demand or seasonal fluctuations might cause us to set up the process differently. |
From applying these tools to timeliness, we should have gained an understanding of whether the issue is either | 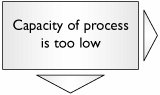 | On average, the process does not have enough capacity (the Cycle Time is longer than its Takt Time). For more detail see "TimeTakt Time" and "TimeGlobal Process Cycle Time" in Chapter 7. The process will never generate enough entities to meet demand. Continue to Section B in this chapter. | | 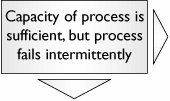 | On average, the process has enough capacity (the Cycle Time is below the Takt Time), but the process fails intermittently. For more detail see "TimeTakt Time" and "TimeGlobal Process Cycle Time" in Chapter 7. On average, the process can meet demand (including peaks), but the process is not robust enough to do so on a continuous basis. Continue to Section F in this chapter. | | 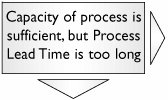 | The Cycle Time is below its Takt Time, but the Process Lead Time is too long. For more detail see "TimeTakt Time", "TimeGlobal Process Cycle Time" and "TimeProcess Lead Time" in Chapter 7. The process can meet customer demand; however, when an entity is required quickly and is not available to ship from inventory, the time taken to generate a whole new entity from scratch is too long. Continue to Section G in this chapter. | | 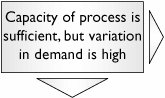 | On average, the process has enough capacity (its Cycle Time is below its Takt Time), but variation in demand causes shortages in available entities intermittently. For more detail see "TimeTakt Time" and "TimeGlobal Process Cycle Time" in Chapter 7. The output of the Demand Profile tool (or Demand Segmentation tool if many entities are run through the process) will show spikes in demand beyond the current capacity of the process. There are two options in this case: Increase the capacity of the process, or smooth the demand from the Customer/market. Continue to Section B in this chapter to increase the capacity of the process. Continue to Section I in this chapter to smooth the demand from the Customer. |
An obvious question arises regarding to how to deal with the situation if the problem is due to more than one of the preceding; what would take priority? Unfortunately, there are no hard-and-fast rules. The approach would be to examine each of the potential options and determine the best approach, perhaps by using an Impact/Effort Graph. In general, it is usually easier to generate more internal capacity rather than change the external reality of customer-demand profiles, but your process/business could be the exception to that. |